
Net Proceeds Toolbox: A Real Estate “Net Sheet” You Can Actually Control
When you sell a house, everyone talks about the price. Very few people talk about what actually matters: your net proceeds — the dollars that land in your account after commissions, credits, fees, payoffs, and “little” line-items that quietly eat your equity.
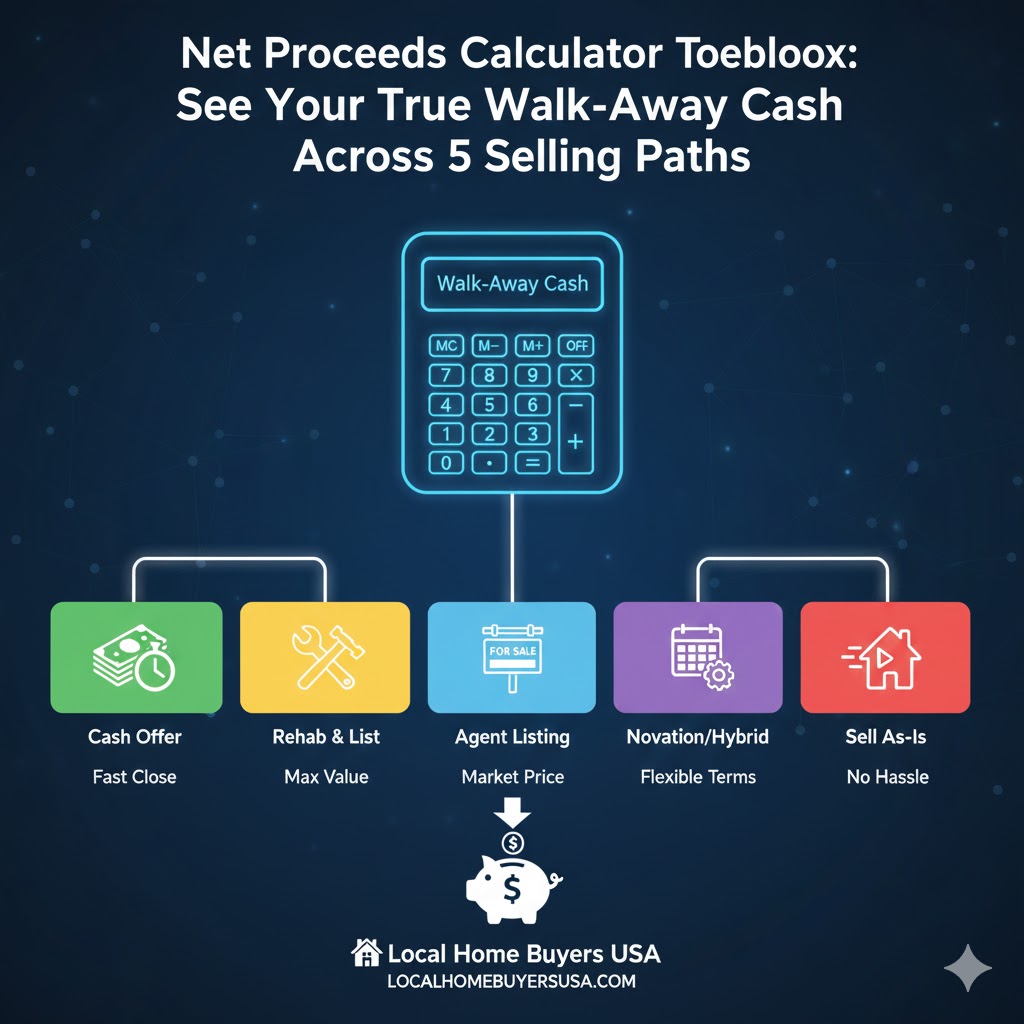
The Net Proceeds Toolbox lets you plug in your numbers across five different ways to sell: listing on the MLS, selling to a cash buyer, going FSBO, using a novation structure, or accepting an instant iBuyer offer. You can see, in seconds, how each path changes your walk-away cash.
Use this like a Bloomberg-style dashboard for your sale. Adjust commissions, credits, repairs, title/escrow costs, transfer taxes, and loan payoffs — the math updates live, and the comparison table shows which option actually pays you the most.
Planning tool only. Always confirm final numbers with your title/escrow company, attorney, and tax advisor.
What “Net Proceeds” Really Means (And Why It’s the Only Number That Matters)
When you look at postcards, online estimates, or even some listing presentations, almost everything is framed around a headline price: “We can get you $400,000!” “Cash offer: $335,000!” “Instant offer: $345,000!”
But your life is not changed by the price on the flyer. It’s changed by what you actually deposit in your bank account after closing. That is your net proceeds.
Simple formula, complicated in the real world
At a high level, your net proceeds look like this:
Sale Price − Selling Costs − Loan Payoffs = Net Proceeds
“Selling costs” is where it gets messy: commissions, buyer credits, title and escrow, transfer or doc stamps, HOA or attorney fees, repairs, and sometimes extra holding costs. That’s why we built a single toolbox that lets you see how all of those pieces move in real time.
How to Use the Net Proceeds Toolbox in 4 Steps
1) Start with the sale price & payoff
For each scenario, plug in your best-guess sale price and your current loan payoff. If you’re not sure of the payoff, use your current balance plus a little buffer for interest and closing-date adjustments.
2) Add the obvious costs
On the MLS and FSBO tabs, make sure you include total commissions and any buyer credits or concessions you’re expecting. On the Cash, Novation, and Instant Offer tabs, focus on service fees, repair credits, and any costs your agreement says you’ll cover.
3) Layer in the quiet (but real) fees
Title and escrow, transfer or doc stamps, HOA charges, attorney fees, and “other” fixed charges can easily add up to thousands of dollars. Add them in so you’re not surprised on closing day.
4) Compare the net across five ways to sell
As you change numbers, the line-item breakdown and the side-by-side comparison table update live. This lets you compare a fast, certain cash sale against a slower, higher-price MLS sale—using the only metric that matters: your net proceeds.
Pro tip: If a scenario keeps you in the house for months longer, add those extra mortgage, tax, utility, and HOA costs into that panel so you’re comparing apples to apples.
Interactive Net Proceeds Calculators (MLS, Cash, FSBO, Novation, iBuyer)
Below are five live calculators. Each one models a different way to sell. All fields are editable, so you can do quick “back-of-the-envelope” estimates or plug in the exact costs you get from a title company, agent, or buyer.
MLS Listing (Traditional Agent)
The classic route. Usually a higher price, but you’ll see commissions, buyer credits, repairs, and extra costs show up in the net.
Line-Item Breakdown (Active Scenario)
| Item | Amount |
|---|---|
| Net Proceeds | $0 |
Net = Price − total selling costs − loan payoff. Final numbers will depend on your exact closing date, fees, and taxes.
Side-by-Side Comparison
| Scenario | Price | Costs | Payoff | Net |
|---|---|---|---|---|
| MLS | $0 | $0 | $0 | $0 |
| Cash | $0 | $0 | $0 | $0 |
| FSBO | $0 | $0 | $0 | $0 |
| Novation | $0 | $0 | $0 | $0 |
| Instant / iBuyer | $0 | $0 | $0 | $0 |
| Highest net (of the five) | $0 | |||
Based on your inputs, MLS currently gives you the highest estimated net.
A higher price doesn’t always win once you layer in commissions, credits, repairs, and time.
This table shows which path actually gives you the most cash at closing.
Real-World Scenarios: When a Cash Offer Beats a Higher MLS Price
Here’s a simple example. Suppose your agent thinks you can list for $350,000. A serious cash buyer offers $330,000. On the surface, the MLS looks better. But inside the toolbox, you might see something like:
- MLS: 6% commission, 1% buyer credits, $6,000 in repairs, $3,000 in extra payments while you wait
- Cash: 0% commission, no repairs, close in 14 days, small title/escrow fee, and you’re done
In that situation, your net proceeds might be surprisingly close. Sometimes, the cash offer even wins by a few thousand dollars — especially if the property needs work or the local market is slowing down.
Use this page to answer three key questions:
- “If I list on the MLS, what’s the best realistic net I can expect after everything?”
- “If I sell to a cash buyer, how much do I really give up — or gain — in net?”
- “Do novation or instant-offer options make sense once I include their fees and repairs?”
Once you see all five paths side by side, you can decide whether speed, certainty, or max price matters most for you.
Ready for a Human-Checked Cash Offer (With a Simple Net Sheet)?
When you’re done playing with the numbers and ready to see a real proposal, our team can review your property details, timeline, and condition, then come back with:
- An as-is cash offer based on your state and local market
- A transparent, easy-to-read net sheet that shows price, costs, payoff, and net-to-you
- Closing options as fast as 7–14 days in many cases, or on your schedule
FAQ: Net Proceeds, Net Sheets & Cash Offers
Is this Net Proceeds Toolbox the same as a “net sheet” from a title company?
It’s very similar in spirit, but more flexible. A title or escrow company can generate an official net sheet based on your specific contract and closing date. This toolbox is a planning tool you can use before you sign anything, so you can compare MLS, cash, FSBO, novation, and instant offers side by side.
Can this replace advice from my agent, attorney, or tax professional?
No. It’s designed to make you more informed, not to give legal, tax, or brokerage advice. Always confirm numbers with your title/escrow company, your real estate professional, and your tax advisor — especially if your property has liens, multiple loans, or special circumstances.
What if I don’t know my exact payoff amount yet?
You can use your current loan balance plus a small buffer for interest and fees. Once you’re under contract, your lender and title/escrow team can provide an exact payoff. When that happens, you can plug the new number into the toolbox to double-check your net.
Does Local Home Buyers USA charge commissions or junk fees?
When you sell directly to Local Home Buyers USA as a cash buyer, there are no traditional real estate commissions. We aim for clear, upfront pricing, so your offer and estimated net sheet match what you see at closing as closely as possible, subject to final title, payoff, and tax details.
Where can I learn more about how Local Home Buyers USA works?
You can start on our main site at LocalHomeBuyersUSA.com , or go straight to our offer page at localhomebuyersusa.com/get-offer . We buy houses in as-is condition across multiple states, with flexible closing options and a focus on clear, net-focused offers.