
We Buy Tenant-Occupied Homes: How to Sell a Rental Property with Tenants (and Price the Occupancy Risk Correctly)
Selling a rental with tenants still living inside is one of the hardest moves in today’s housing market. Retail buyers get nervous, timelines stretch, and “simple” deals turn into legal and logistical knots. This guide shows how we buy tenant-occupied homes, how we price the occupancy risk, and what the data actually says about selling with renters still in place.

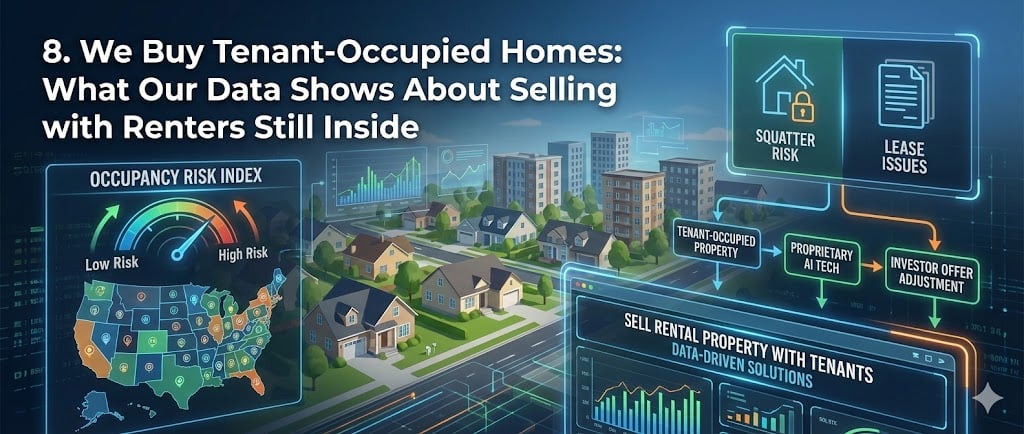
Illustrative metrics based on tenant-occupied deals we see nationwide. Not legal advice or an appraisal—your numbers will vary by state, lease, and tenant history.
Want out of a tenant-occupied property—without a court battle?
We buy rentals with tenants still inside, nationwide. Our models price occupancy risk up front using an internal Occupancy Risk Index (ORI), so you see a clear number instead of months of guesswork.
No obligations. We buy as-is, with tenants in place or on a planned move-out timeline.
Occupancy Risk Console (ORI)
Plug in your rent roll, state risk, and tenant status to see an estimated Occupancy Risk Index (ORI), discount range for selling with tenants in place, and what that implies for a cash offer vs. vacant value.
Your Property & Tenant Snapshot
What actually hits your account, not theoretical.
What similar rentals in your area are getting today.
Rough feel is fine—we’ll adjust the model accordingly.
Modeled Occupancy Risk & Price Bands
0.00–1.00 scale. Lower is easier to sell with tenants in place; higher means more discount and timeline risk.
Based on an estimated — occupancy discount vs. vacant value.
Illustrative “if vacant” value you entered above, before repairs or listing costs.
Adjust the sliders and dropdowns on the left to see how state law, tenant history, and rent roll shape an as-is tenant-occupied offer.
Snapshot of your inputs
- Vacant value: $0
- Monthly rent collected: $0
- Market rent estimate: $0
- Rent coverage vs. market: —
- Monthly under/over market: —
- Months behind (if any): 0
- State climate: Balanced
- Tenant status: Paying on time
- Timeline preference: ASAP (30–60 days)
This console is a planning tool, not legal advice or a formal appraisal. For a written offer on your specific rental, ask us to model your property directly.
Email Me This Tenant-Occupied Analysis
Not ready to sell today? Send yourself a copy of this ORI snapshot so you can revisit the math with a spouse, partner, or advisor.
Why Selling with Tenants Is So Hard in 2025–2026
On paper, selling a rental property with tenants inside seems straightforward: keep collecting rent, let the new buyer take over, and avoid months of vacancy or conflict.
In reality, that’s not how most sales play out.
Eviction moratorium scars, stricter tenant protections, and lender overlays have made many buyers allergic to anything with occupancy risk. Meanwhile, investors are running tighter math as rates, taxes, insurance, and repair costs stay high.
Good tenants in a good property can be an asset. The wrong lease, wrong timeline, or wrong jurisdiction can turn the same asset into a liability—and the offers you get will reflect that.
At Local Home Buyers USA, powered by the research of PropTechUSA.ai, we buy tenant-occupied homes every week across all 50 states. Our models already track micro-market stress, sentiment, and time-to-sell through tools like:
- HSS + API: Home-Sale Sentiment & Predicted Days on Market
- Zestimate Blind Spots: Algorithmic Home Values
- Interest Rate Lag & Housing
This same research backbone now powers our Occupancy Risk Index (ORI)—our way of turning messy tenant situations into clear, data-backed pricing.
Seller-Simplified: What This Means for You
You don’t have to evict first, guess what your tenants are “worth,” or pray a landlord buyer shows up.
- We buy tenant-occupied homes nationwide—paying you for the property with existing leases.
- We price the occupancy risk up front using our Occupancy Risk Index (ORI), not gut feel.
- You see a clear net sheet vs. trying to empty the property and list on the open market.
- You can compare paths side-by-side at Compare Home Offers.
Why Most Retail Buyers Flee Tenant-Occupied Listings
If you’ve tried to sell a rental property with tenants before, you’ve probably heard some version of:
- “We love the house, but we really want it vacant at closing.”
- “Our lender won’t allow us to close with that lease in place.”
- “We’re nervous about taking on someone else’s tenant problems.”
Here’s what’s really going on behind the scenes.
1. Lenders Don’t Like Uncertainty
Financing underwriters are paid to imagine what could go wrong. Unknown lease terms, side agreements, and cash deals off the books make them nervous. If they can’t clearly plug the lease into their model, they often push for vacant at closing.
2. Buyers Remember Eviction Moratoriums
Many buyers watched friends or family go months (or years) without rent during COVID-era restrictions. That scar tissue makes even a good tenant feel risky—especially in states with strong tenant protections.
3. “Rent Roll Reality” vs. Pro Forma Fantasy
Investors have been burned by optimistic pro formas. If your rent roll is below market, spotty, or full of handshake deals, buyers will price in the work it takes to stabilize—or walk away entirely.
4. Squatter Risk & “Professional Tenants”
In some markets, the fear isn’t just non-payment—it’s a drawn-out legal battle. That’s why our Closing Risk Score (FOS) and occupancy modules specifically flag squatter risk zones.
The result? Many retail listings with tenants either sit longer, take bigger price cuts, or fall out of escrow—exactly the patterns we surface in our HSS/API sentiment models.
Introducing the Occupancy Risk Index (ORI)
To move beyond guesswork, our research team built the Occupancy Risk Index (ORI)—a 0.00–1.00 scale that summarizes how much occupancy risk your property carries in the current market.
At a high level, we blend three pillars:
- Legal friction (state & local law, notice requirements, eviction timelines)
- Tenant profile (payment history, lease terms, communication, cooperation risk)
- Market appetite (investor demand for occupied vs. vacant in your micro-market)
Conceptually, ORI looks like this:
- ORI 0.10–0.35: Low occupancy risk. Clean leases, strong payment history, landlord-friendly law.
- ORI 0.36–0.65: Moderate risk. Mixed payment, mid-tier protections, some lease or notice complexity.
- ORI 0.66–1.00: High risk. Chronic non-payment, squatter behavior, lengthy legal timelines, or hostile tenants.
ORI plugs into the same decision engines we use for condition and renovation math in our Renovation Value Index (RVI). Together, they help us answer:
- “How much discount is tied to physical condition vs. occupancy?”
- “What does a realistic as-is, tenant-in-place offer look like today?”
- “What’s the upside if/when the property can be delivered vacant?”
How State Laws and Eviction Timelines Shape Your Offer
One of the hardest parts of selling with tenants? Every state plays by different rules. A non-paying tenant in one state might be cleared in 30–45 days. In another, the same situation might take 6–12 months.
What We Look At (Without Giving Legal Advice)
- Average timeline from notice to vacant in your county for non-payment cases.
- Whether your lease is month-to-month or fixed-term, and when that term ends.
- Local rules for cash-for-keys or negotiated move-outs.
- “Just cause” restrictions and special protections (elderly, disability, rent control zones, etc.).
- Historical patterns we see in our own deals—where investors are tightening vs. staying aggressive.
We feed those inputs into our ORI model and our broader timing research—including our Interest Rate Lag work and our seller stress & timing frameworks—to arrive at a realistic, state-specific offer range.
Pricing a Tenant-Occupied Sale: A Simple Framework
While every property is different, most tenant-occupied pricing decisions come down to four levers:
- Base property value: What would this home be worth vacant, in its current condition?
- Condition discount: What does our RVI say about repairs and systems risk?
- Occupancy Risk Index (ORI): How heavy is the tenant/eviction/lease risk?
- Timeline preference: How quickly do you need to be done?
In plain English:
- Lower ORI + solid property = tighter discount, especially if rents are at or above market.
- Higher ORI + tired property = deeper discount, because we’re taking on more “unknowns” and time risk.
- Aggressive closing timelines shorten the runway we have to solve problems—so they can widen spreads slightly.
We then convert this into a clear net comparison vs. trying to vacate and go retail. You can see the same style of math in our Compare Home Offers tool and our Closing Risk Score (FOS).
Should You Wait for Vacant or Sell with Tenants Still Inside?
There’s no one-size-fits-all answer—but there is a better question:
“Will the extra price I might get vacant be larger than the cost, time, and risk of getting there?”
Some situations favor selling now with tenants:
- You’re behind on payments, taxes, or facing a hard deadline.
- Your tenants are paying but won’t cooperate with showings or inspections.
- The property needs significant repairs that would trigger inspection or code issues.
- You’re out of state and tired of the midnight maintenance calls.
Other situations may justify a path toward vacancy first:
- Your ORI is relatively low and your state allows for clean, predictable notice.
- The home is otherwise “retail-safe” once cleaned and lightly refreshed.
- You can comfortably carry the mortgage and repairs through the transition.
Our job isn’t to force one answer. It’s to map the math, timelines, and closing risk clearly so you can decide. That’s the same philosophy behind tools like our HSS/API sentiment research and our net-sheet modeling.
How Local Home Buyers USA Buys Tenant-Occupied Homes
Here’s what it looks like when you work with us on a tenant-occupied property:
1. Quick Snapshot (Property + Occupancy)
You share basic details online or by phone:
- Property type, beds/baths, condition level.
- Tenant status: paying, partial, or non-paying; lease end date; any notices already sent.
- Your priorities: net, timing, and privacy.
2. Occupancy Risk Index (ORI) + Closing Risk
We run our internal models:
- ORI: How heavy is the occupancy risk in your state and situation?
- Closing Risk Score (FOS): Based on our “easy sell” framework.
- Condition/Renovation-VI: Where you sit on the Renovation Value Index.
3. Clear Options, Not Just One Number
We lay out options in plain English, often including:
- A straight cash offer with tenants in place.
- A structured path to vacant (if that math looks better).
- Hybrid or partnership ideas if you want a share of future upside.
4. A Real Timeline You Can Plan Around
Because we buy in all 50 states and handle tenant-occupied deals daily, we can:
- Close in as little as 7–21 days in many cases (title-dependent).
- Coordinate with your tenants respectfully and professionally.
- Help you avoid last-minute surprises that blow up buyer financing.
Want a no-pressure number for your tenant-occupied property?
We’ll factor in your tenants, state law, and repair list—then show you how a tenant-in-place sale compares to going vacant and listing.
FAQs: We Buy Tenant-Occupied Homes
Do I have to evict my tenants before you’ll make an offer?
No. In many cases, we specifically buy with tenants in place. We’ll price the occupancy risk into our offer using our Occupancy Risk Index (ORI) and show you how that compares to trying to deliver the property vacant.
What if my tenants are not paying rent?
We buy non-paying and behind-on-rent situations nationwide. Your ORI score will likely be higher (more risk), but you still get a clear cash option instead of carrying months of uncertainty yourself.
Will my tenants be kicked out immediately?
Every state is different, and we don’t give legal advice. What we do is approach tenants professionally, follow local rules, and look for win-win solutions where possible, including cash-for-keys or planned move-out timelines.
Can you buy my rental even if it needs repairs?
Yes. Our Renovation Value Index (RVI) and ORI work together. We price both condition risk and occupancy risk up front, so you’re not doing repairs or evictions just to “get ready” for a sale.
How fast can you close on a tenant-occupied home?
It depends on title, state, and complexity, but many tenant-occupied purchases close in 7–21 days. In more complex cases, we’ll give you a realistic range—not a fantasy date.