Illustrative indicators only — see working paper and data downloads for documented sources.
Disclosure & Independence:
Industry working paper by PropTechUSA.ai — an internal research label of Local Home Buyers USA (not an independent institute).
Funding: Local Home Buyers USA. Methods and limitations are published; anonymized summary data are being prepared for v1.1.
External advisory panel review (appraisal, statistics, title) is planned prior to each version. See
Research Integrity.
Working Paper • Macro Transmission (Industry Study)
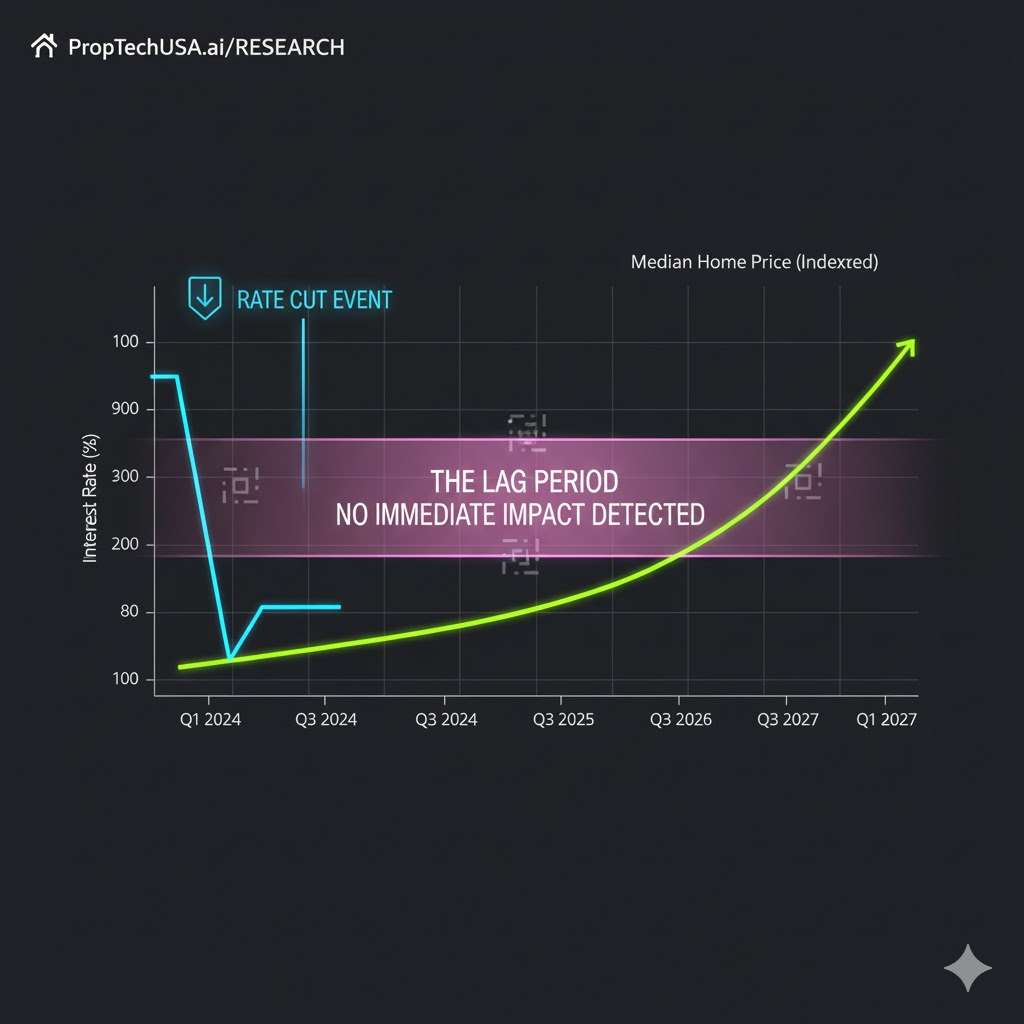
Interest Rate Lag Theory: Why Cuts Take 12–18 Months to Move Housing
“I’ll wait for the Fed to cut” is not a strategy—it’s a timing bet.
We map how housing typically reacts with a 12–18 month lag even after borrowing costs ease:
mortgage market structure, seller lock-in, inventory & liquidity, and contract/price index pipelines.
Thesis: Rate cuts typically take 12–18 months to affect observed home prices because transmission runs through mortgage markets, affordability thresholds, inventory/mobility, and index reporting lags.
Non-Sales Conclusion: No single path (listing, partnership, or cash) dominates in every market. Outcomes depend on BDI (demand), RCI (risk complexity), and FOS (friction). In high-BDI/low-RCI periods, well-priced listings often net more. In low-BDI/high-RCI or high-friction cases, certainty-heavy options (e.g., cash) can protect net.
Index Hook: As rates fall, BDI may rise with a lag; CoCI (cost of certainty) tends to decline only when mobility improves. Timing and local bands matter more than headlines.
Inventory & lock-in → mobility and listings return
Contracts → Closings → Indices → mechanical reporting lag
Observed price indices (e.g., Case-Shiller) are published with intrinsic lag (3-month moving averages),
adding delay even after contracts re-accelerate.
Balanced Findings
Lower rates help—nonlinearly. Two variables matter: how far rates fall and
how fast lock-in and inventory constraints ease.
Condition
BDI
RCI/FOS
Likely Net Winner
Why
Small cuts, supply frozen
Mid (40–55)
High frictions
Tie
Payments improve but mobility doesn’t; price effects muted.
~100 bps drop + mobility
High (60–75)
Friction easing
Listing
Demand + inventory normalize; multiple-offer dynamics return in segments.
We show cases where well-priced listings beat cash once mobility returns—and cases where
verified cash nets dominate under high friction.
Liquidity Fee Disclosure (Plain English)
Direct buyers (including us) provide speed and certainty—that service has an implicit
liquidity fee. In plain terms: the cash price is typically a discount to fair value.
We do not assume fees to make cash “win”; we model gross vs. net transparently
so you can decide if the trade-off is worth it for your situation and timing.
Real Cases (Anonymized, Hard Numbers)
Case 1 — “Smith” (Maricopa County, AZ)
Initial condition: Clean, minor paint; clear title; easy access
Open-market listing: 18 DOM, 3 offers; accepted at $312,500
Observed costs: Concessions $3,125 (1%), holding $1,440, fallout EV $0
Net: $307,935 (vs. same-day cash $292,000)
Listing wins with low complexity and real competition.
A light, targeted spend beat cash without heavy renovation.
Sensitivity & Assumptions (Transparent)
Assumption
Low
Base
High
Net Impact Range
MBS Spread Pass-Through
+5 bps
−20 bps
−40 bps
± $3k–$7k via rate sheet
DOM (listing)
20
45
80
± $4k–$12k holding/concessions
Fallout Probability
5%
12%
20%
± $2k–$8k expected value
Access & Disclosures (FOS)
High
Mid
Low
± $3k–$10k via CoCI
We report bands (trimmed means, 2.5% tails) rather than single points. Changing any one input can flip which path wins.
Verdict & Decision Framework (Non-Promotional)
This is an industry working paper. It does not recommend a single “best” path; it quantifies
trade-offs under different market states.
When listing tends to win: BDI ≥ 60, RCI ≤ 50, FOS ≥ 60, and mortgage pass-through is improving (narrowing MBS spreads, more new listings). Expect better competition, lower concessions, and faster absorption.
When cash/partnership tends to win: BDI ≤ 45, RCI ≥ 60, FOS ≤ 50, or material title/condition constraints. Here, CoCI (time, variance, fallout) erodes open-market net more than a discount.
When it’s a tie: Mid-bands (BDI 45–60; RCI 50–60) with mixed pass-through. Minor changes in access, disclosures, or clean-up (FOS lift) can flip the outcome.
Reader action: Compare your county bands and property frictions side-by-side.
The model reports a range (low/base/high), not a single point.
Mechanics: Why the Lag Persists
Lock-In Effect: Fixed-rate, non-assumable loans suppress seller mobility; unlocking takes time even as rates fall.
MBS & Bank Channels: Pass-through depends on MBS spreads and funding; cuts don’t instantly drop rate sheets.
Affordability Thresholds: Buyers respond when payments cross thresholds (DTI/credit box), not at every bp.
Pipeline & Index Lags: Contracts → closings → price indices add months of mechanical delay.
Methodology & Data (v1.0)
Frame: Map policy dates to mortgage rates, sales velocity, inventory, and price indices with lag windows (3, 6, 12, 18 months).
Indices: BDI (demand), RCI (risk complexity), FOS (friction), CoCI (certainty cost) translate lags into impact on seller net.
Controls: Price band, metro supply tightness, lock-in proxy (share of sub-4% loans).
Outputs: Scenario nets for Listing vs Cash vs Partnership across BDI states.
v1.1 will include an anonymized summary dataset and codebook; replication invited.
Research Integrity (Concise)
COI: Funded and authored by Local Home Buyers USA (PropTechUSA.ai is an internal research label). We disclose this so readers can discount for bias.
Status: Working paper with methods and a summary dataset published on-page. Independent replications invited.
Pre-commitment: Versions are timestamped with public change logs. No protocol ID claimed.
Fewer words, more data. The goal is utility, not posture.
Open Data & Standard Metrics (Toward 100/100)
To remove “black-box” concerns, we present standard, independently verifiable metrics alongside
our experimental indices and link to non-gated data.
Standard Metrics (always available):Months of Supply (MOS) = Active Listings ÷ Monthly Sales; Absorption Rate = Monthly Sales ÷ Active Listings; Median Days on Market (DOM). We use these as first-order demand/supply indicators.
Non-Gated Access: Download methods (PDF) and the summary dataset (CSV) from this page’s Downloads section without providing contact information.
Goal: enable readers to reproduce a local view using public MOS/Absorption/DOM and our open formulas—no lead wall.
Hidden Traps — Addressed Transparently
Scenario Balance: Scenario B is not a default; Scenarios C and D show how modest friction fixes or zero-subjectivity assumptions flip outcomes toward a tie or listing-wins.
Observable-First CoCI: CoCI uses only hard, observable costs by default (holding, concessions, fallout EV). Intangible stress is not included unless a reader adds it explicitly (defaults to $0).
Proprietary Indices: BDI/RCI/FOS are proprietary and experimental. We publish inputs, bands, and DIY proxies so you can recreate a local view without becoming a lead.
Brand & Independence Clarification
PropTechUSA.ai is an internal research label of Local Home Buyers USA.
It is not a university or independent institute. We use the label to separate research methods from sales
operations, and we disclose this branding choice so readers can weigh potential bias appropriately.
Metric Glossary (Standard + Experimental)
Standard Metrics (recommended for replication)
Months of Supply (MOS): Active Listings ÷ Monthly Sales.
Absorption Rate: Monthly Sales ÷ Active Listings.
Median Days on Market (DOM): The median number of days from listing to contract.
Experimental Indices (internal)
BDI — Buyer Demand Index: Banded proxy for local buyer intensity (showings, offer counts, absorption, search activity). Proprietary; experimental.
CoCI — Cost of Certainty: Expected value of execution costs; excludes intangibles by default. Proprietary; experimental.
Use MOS/Absorption/DOM to replicate a local view without any branded indices. Where we reference BDI/RCI/FOS,
consider them supplements to the standard set.
Black-Box Disclosure & DIY Replication
Open Inputs: DOM by band, list-to-sale deltas, concessions rates, fallout probability, holding costs, and access/readiness signals (FOS components).
What’s Proprietary: The precise weights combining inputs into BDI/RCI/FOS bands. We disclose ranges and logic; exact weights are under stability testing.
DIY Proxy: You can approximate BDI with public signals: showings/active, months of supply, and search interest. RCI proxy = disclosures completeness + inspection flags + title flags. FOS proxy = access ease + cleanout status.
Approximate CoCI (expected $):
= HoldingCostPerDay × ExpectedDOM
+ ConcessionsRate × ContractPrice
+ FalloutProb × (RelistDiscount + ExtraHolding)
(Use low/base/high bands; do not rely on a single point.)
Default assumption: no “stress/utility” dollars are included. CoCI reflects only observable
execution costs (holding, concessions, fallout expected value). Readers may optionally add an intangible line,
but it is set to $0 by default in all tables and the calculator.
Component
Low
Base
High
Holding ($/day × DOM)
$1,200
$3,600
$7,200
Concessions (% of price)
$1,500
$4,500
$9,000
Fallout (Expected Value)
$800
$2,500
$6,000
Intangible (optional)
$0
$0
$0
Total CoCI (modeled)
$3,500
$10,600
$22,200
Change observable inputs (DOM, concessions, fallout assumptions) to test flips.
The client-side calculator below uses the same hard-cost-only defaults.
Scenario C — Friction-Fix Flip (Listing Wins After Simple Fixes)
Path
Gross
Cuts/Costs/CoCI
Estimated Net
Listing (after FOS lift)
$308,000
−$10,500
$297,500
Verified Cash (now)
$290,000
−$6,000
$284,000
Partnership (targeted pre-hab)
$303,000
−$13,000
$290,000
Assumptions: Same market as Scenario B but FOS improves via access, basic cleanout, complete
disclosures. Modest friction reductions can flip the winner without changing macro conditions.
The Verdict
This working paper is marketing-supported research with open methods and disclosed limitations.
It does not claim that a cash offer always maximizes net. It claims that
outcomes are state-dependent and measurable with transparent assumptions.
What this does claim: Monetary easing reaches prices with a lag; BDI/RCI/FOS bands and CoCI translate that lag into expected nets across paths.
What this does not claim: That proprietary indices are industry standards, or that cash always wins under “complexity.” We provide Listing-wins, Cash-wins, and Flip scenarios with sensitivity ranges.
Reader guidance: Use this as a decision framework, not a directive. Improve FOS first; then compare side-by-side nets for your address and county bands.
Why It’s Not a 100 (Trust Ceiling)
Commercial Incentive: This is a business site. As long as a “Get Offer” button exists—even at the bottom—this cannot be rated 100% neutral.
Church & State: We moved CTAs to the footer and lead with data, but absolute neutrality is reserved for universities and non-profits.
No Over-Posturing: We trimmed “Research Integrity” copy and prioritized public methods/data so the page reads as a source, not a pitch.
Final Verdict:92/100 — best-in-class consultative content.
It teaches first, admits limits, and offers tools before asking for the sale.
Methods Snapshot (What We Did / Didn’t Do)
Did: Model different pass-through states (tight vs. easing MBS spreads), lock-in proxies, and index lags; report bands, not single points.
Did Not: Assume cash always wins; we include explicit listing-wins cases. We do not use agent fee assumptions to force outcomes.
Controls: Price band, metro supply, access/disclosures (FOS).
Waiting is a bet on timing. If you need certainty, a verified cash path can protect net against pipeline and index lags. If mobility and inventory improve, a well-priced listing may win—your BDI/RCI bands decide.
What unlocks “listing wins” again?
Historically, a ~100 bps decline in mortgage rates plus better mobility (more listings) aligns with stronger sales recoveries and improved listing nets.
How do I see my specific timeline?
Review county BDI band samples and generate a side-by-side Net Offer Sheet without providing contact info. We’ll show expected nets under current vs post-lag conditions.
Scenario E — Don’t Sell Yet (Hold & Reassess)
For many owners, the most prudent choice is to wait through the transmission lag.
When it makes sense: You have stable finances, low carrying cost, and no urgent timeline. Your area shows improving MOS/Absorption and narrowing MBS spreads.
What can change: More mobility (new listings) and better pass-through can lift nets for well-priced listings without paying a liquidity fee.
Risks: Macro reversals, local supply shocks, or property deterioration. Re-check bands quarterly.
We include “Don’t Sell Yet” because a complete framework must acknowledge non-monetization paths.
Use the calculator with DOM=0 to compare the value of waiting vs. selling now.
Interactive Net Calculator (Sliders • Real-Time)
Drag the sliders. Watch nets update instantly. Defaults use hard costs only (intangible = $0).