
PricingMethod
Unified PropTechUSA.ai Net Offer Sheet
How our indices come together into a single, seller-facing offer with transparent line-items and guardrails.
Tech focus: Hyperlocal Sentiment Score (HSS) and Anxiety Premium Index (API). This forecast blends search-sentiment, stress signals, and pricing history to estimate Net Seller Sentiment (NSS) across the top U.S. metros — and what that implies for your Predicted Days on Market and a fair Recommended Spread if you sell for cash.
In plain English: HSS is “how good it feels to own here,” and API is “how nervous people are about money & housing right now.” NSS is the tug-of-war between the two.
Pair this model with our behavioral read on search sentiment & seller psychology, our risk lens in the Uninsurable Index & safety scores, and the macro backdrop in How Global Events Are Reshaping the Real Estate Market in 2025.

HSS gauges local optimism vs. pessimism from public chatter — neighborhood forums, reviews, local news tone, and civic activity. API quantifies growth in stress-driven search behavior: “sell my house fast,” delinquency help, tax lien risk, and insurance shock queries. Together, they produce a metro-level Net Seller Sentiment (NSS) that we use to:
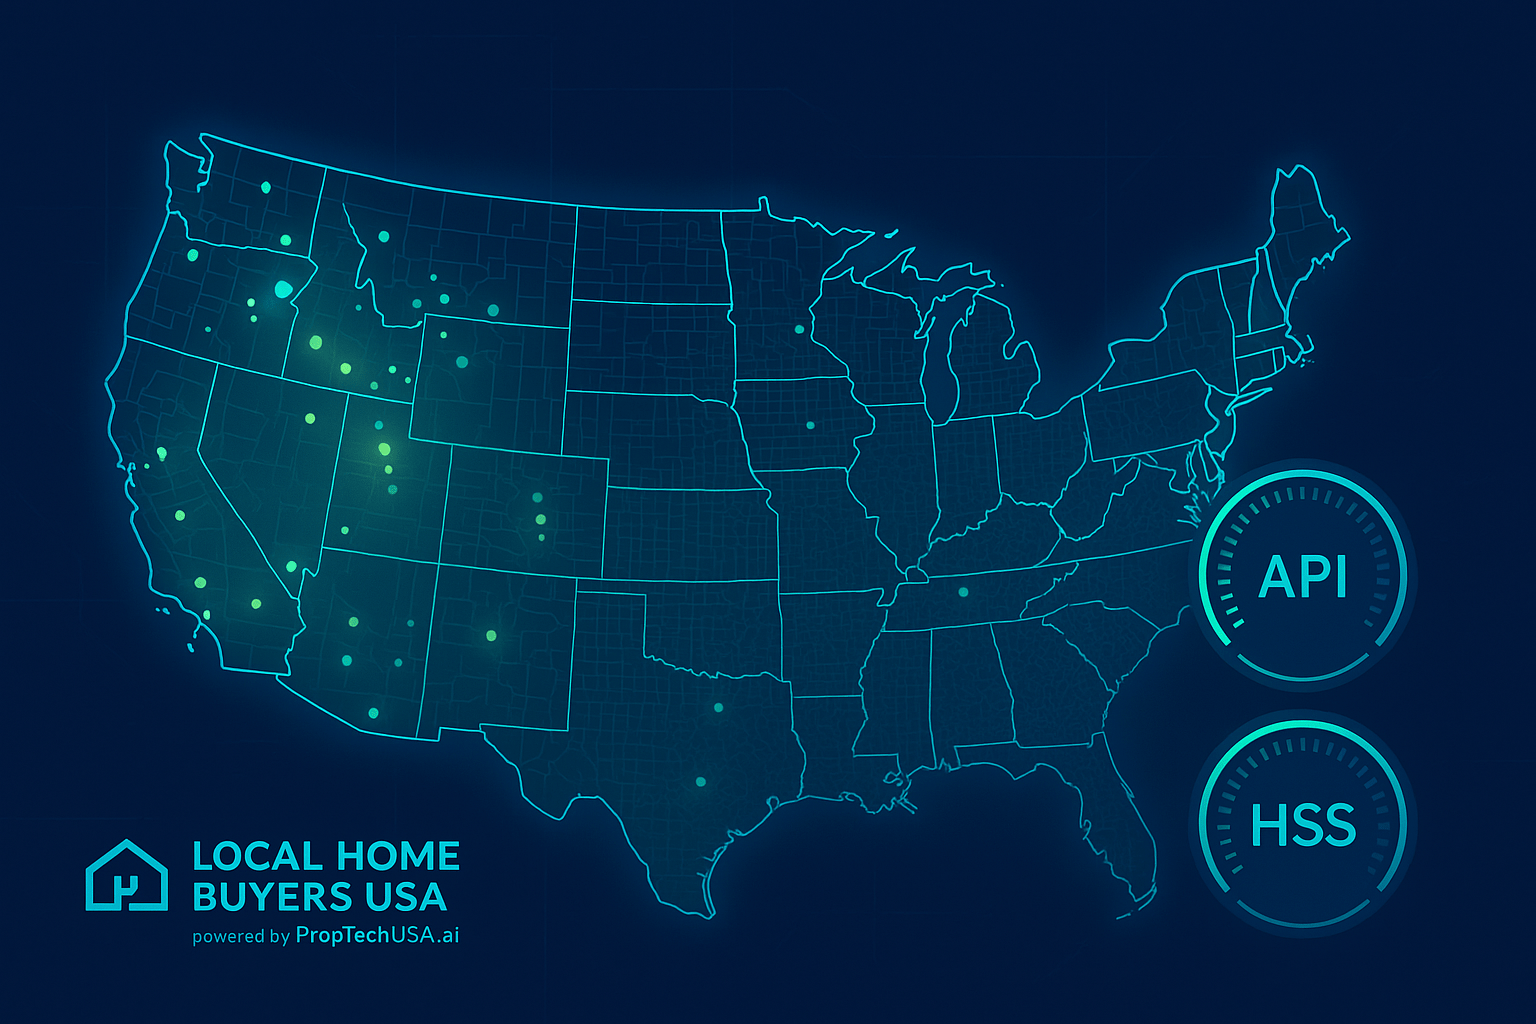
Each bubble represents a metro’s Net Seller Sentiment. Size reflects the magnitude of tilt (how far from neutral); color reflects risk: green for calmer conditions, yellow for elevated anxiety, red for high stress. Use this alongside our pieces on 2026 tech trends and How to Sell Your House Fast in Today’s Market to choose your sale path.
Click a metro to highlight its row in the back-test table. Data powered by PropTechUSA.ai.
Enter your ZIP code to see an instant HSS/API estimate and a suggested Recommended Spread band. This is a decision aide — your final offer still adjusts after a 10-minute scope call and title check, plus any local risk flags from our Uninsurable Index.
Waiting for input…
We map API (risk) tempered by HSS (confidence). These bands are guidance for a fair cash discount that trades time & stress for certainty. If you’d rather keep the upside, our team can quote a partnership or novation path instead.
| Band | Range | When used |
|---|---|---|
| Low | 2% – 4% | Calm markets (API ≤ 25 & HSS ≥ 60) |
| Base | 4% – 6% | Balanced sentiment (API 25–45 or HSS ≈ 50–60) |
| Elevated | 6% – 9% | Visible stress (API 45–65) |
| High | 9% – 12% | Acute stress (API ≥ 65 or NSS ≤ −10) |
Want a human review of your ZIP and property? Call 1-800-858-0588 or visit Get Offer. For tactical playbooks, see: How to Sell Your House Fast in Today’s Market, From iBuyer Winter to PropTech 2.0, and Compare Home Offers.
A high API means buyers are scared, so they need a bigger discount to sign. A low API means buyers are confident, so we can pay more.
We continuously measure predicted vs. actual time-on-market and price-cut rates by metro. Confidence rises when signals are stable and the model tracks reality; it falls when volatility spikes (insurance rerates, new regulation, or local employment shocks). These same metros tend to show up in our Uninsurable Index and “PropTech 2.0” work.
For sellers, the takeaway is simple: this dashboard helps you decide whether to go for a premium retail path with higher risk or a discounted but safer cash exit. You can change your strategy — the model simply makes the trade-offs visible.
Explore how this dashboard plugs into our broader PropTech stack — from behavioral search indices to risk frameworks and step-by-step seller guides.
We call a metro “Anxious” when API is high and HSS is still reacting to news — sellers feel the pressure and start searching solutions. It turns “Apathetic” when API stays high but HSS stops moving: people are numb to headlines and delay action. In practice, spreads stay elevated while time-on-market creeps up. That’s usually the moment to act, not wait.
Treat the band as a lane marker, not a quote. If your property is clean, insurable, and move-in ready, you may land at the low side of the band or below it. If you are facing back taxes, code issues, or insurance problems, you may land at the high side. Our team will also show you a “keep the upside” track inspired by our PropTech 2.0 work.
Yes. The fastest way to move — without blowing up your net — is to combine this forecast with the playbooks in How to Sell Your House Fast in Today’s Market. That guide shows how to choose between a retail listing, hybrid path, or direct cash sale based on your Pred DOM, risk tolerance, and timeline.
Local Home Buyers USA — powered by PropTechUSA.ai. We combine dashboards like this with real humans who walk your property, talk through your timeline, and show you the math in plain English. You can pick:
Start here: Get Offer or call 1-800-858-0588. We’ll run your address through this dashboard and our other indices, then show you exactly what “fast, fair, and data-backed” looks like for your situation.