
PricingMethod
Unified PropTechUSA.ai Net Offer Sheet
How our indices come together into a single, seller-facing offer with transparent line-items and guardrails.
Online estimates are a starting range, not a verdict. This page gives you a trader-grade view of AVM error, shows where models break, and lets you run your own Reality Check in under 60 seconds—before you decide between a retail listing and an as-is cash exit.
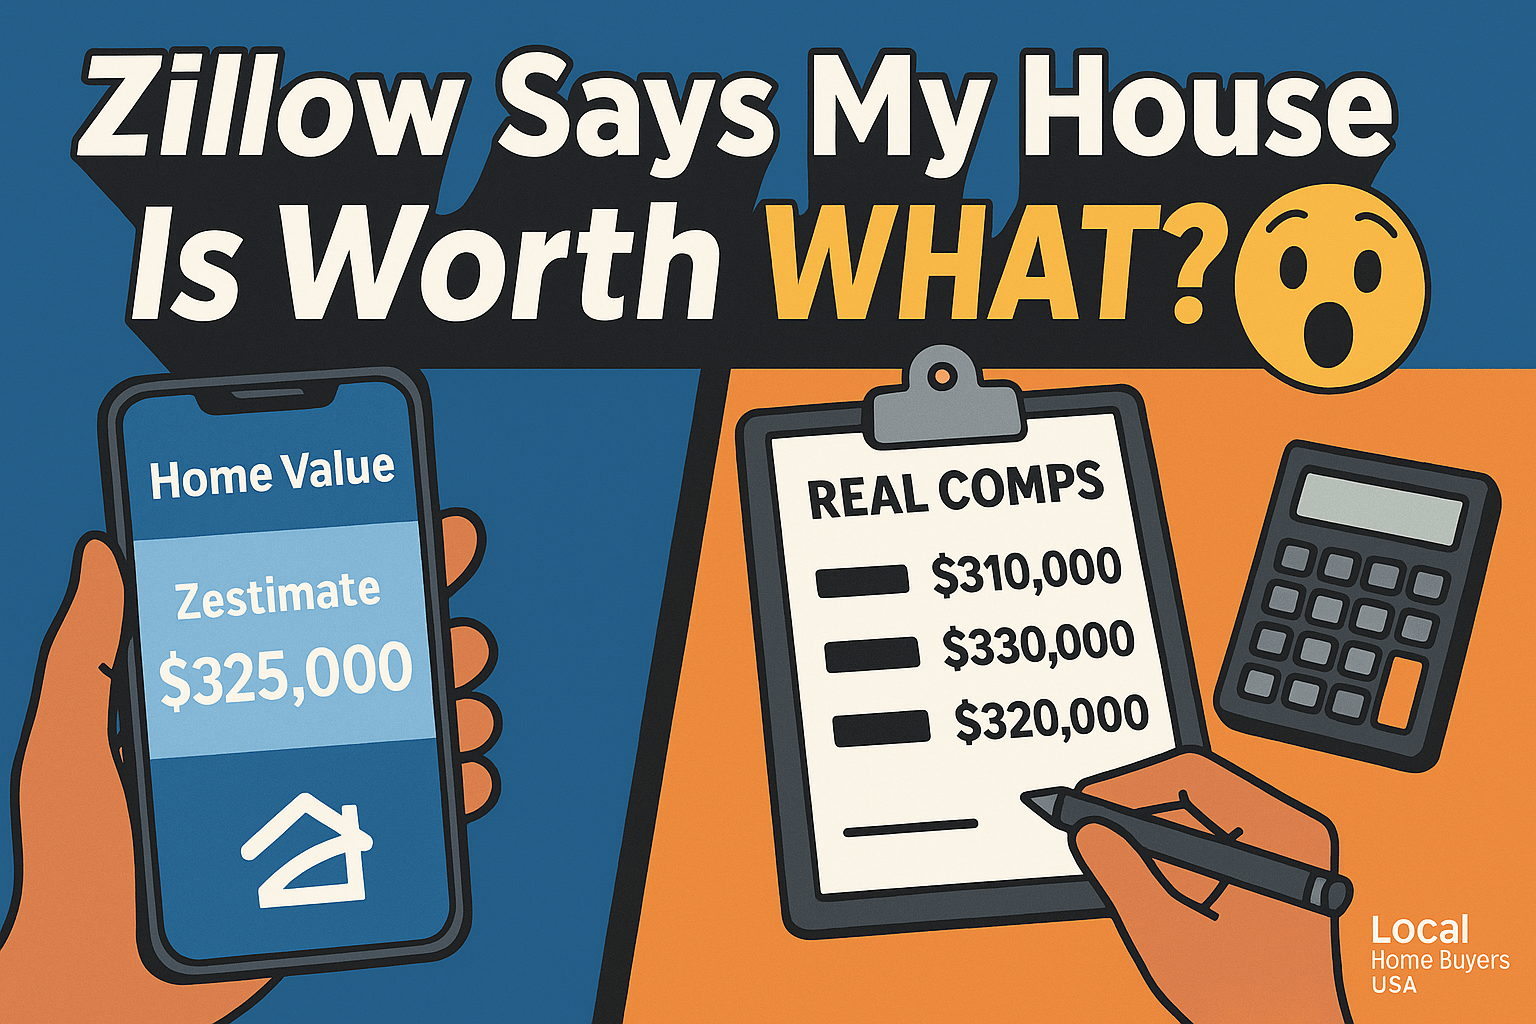
AVMs—automated valuation models—combine recent sales (comps), listing data, tax records, and neighborhood features to estimate what a willing buyer might pay. They’re great at pattern-matching in data-rich subdivisions and less reliable where the data is sparse, stale, or the home is unique.
This article is educational and not appraisal or legal advice. Always consult licensed professionals for decisions that require formal valuation.

Prefer a human reality check? Skip the spreadsheet and get a no-obligation cash offer.
The charts below use light-green lines and fills so they stay sharply legible against the dark backdrop. They’re illustrative, not market-specific, but they mirror what we see across thousands of deals.
Median error (solid green) and P80 error (dotted light green) get wider as properties become more unique or markets thin out.
Positive bars show cases where on-market buyers beat the algorithm; negative bars reflect repairs, tenants, or distressed terms.
First, consider how regimes shape pricing dynamics. During low-rate periods, buyer demand expands and time-on-market compresses; consequently, AVMs that lean on momentum features tend to perform better. Conversely, when rates rise and affordability tightens, the mix of sold homes shifts toward concessions and condition-adjusted pricing. The very same neighborhood can exhibit two different truths within a year, and algorithms trained on multi-year windows may lag those shifts.
Additionally, data latency matters. Some counties post transfers weekly; others batch monthly. If your sale closed last Friday but has not hit the recorder yet, your estimate may be anchored to stale comps. A human comp pass that privileges recency over algorithmic confidence can beat the model. Finally, heterogeneity—unique floor plans, pie-shaped lots, or unpermitted square footage—introduces noise that inflates error ranges, even when the median error across the metro looks small on paper.
Treat the AVM as a range input, then run it through a simple net-sheet lens. The table below is now rendered in a high-contrast, light-green friendly theme so it stays readable on every device.
| Path | Typical Costs | Risk/Timing | Best For |
|---|---|---|---|
| MLS (Retail) | Agent fees, prep/repairs, concessions | Longer, less certain | Updated homes, flexible timelines |
| Wholetail / Light Rehab | Cosmetic repairs, modest holding costs | Moderate | Solid bones, cosmetic updates needed |
| Direct Cash | Minimal seller costs | Fast, highly certain | As-is, inherited, tenant-occupied, heavy repairs |
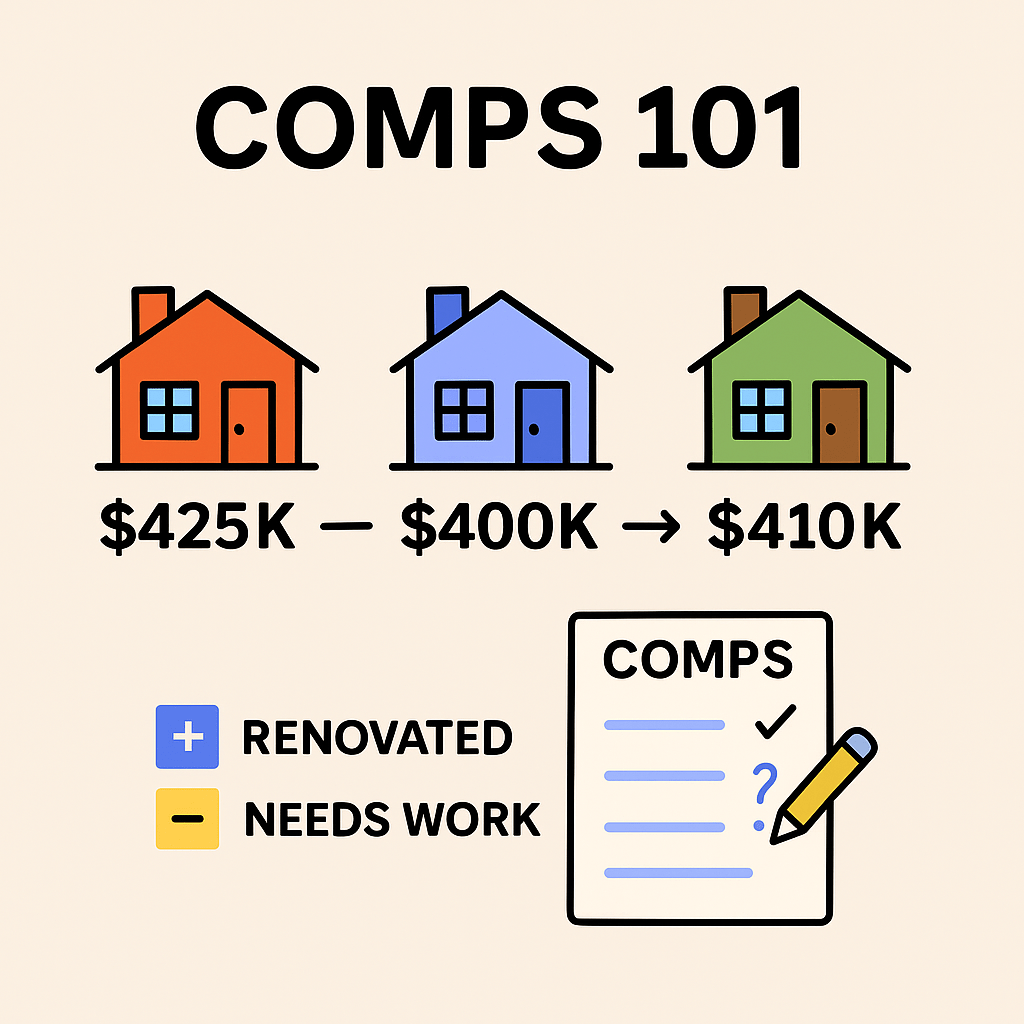
Start with the AVM as a range, not a verdict. Then, gather three to five comps, normalize for condition, and bracket a realistic outcome. After that, decide your path: retail MLS with prep, hybrid wholetail, or a direct as-is cash sale. If speed, certainty, and privacy dominate, a cash offer can maximize your net when repairs, carrying costs, or timeline risk loom large. Otherwise, when the home shows well and the calendar is flexible, the MLS may produce a premium—provided pricing aligns with today’s buyers, not last season’s headlines.
To support transparency and education, we include two illustrative datasets. These are small, non-market samples designed to show methodology—not to represent your specific neighborhood. Both datasets are licensed under CC BY 4.0 so you can remix and cite with attribution.
Columns: market_type, property_type, median_error_pct, p80_error_pct, notes
| market_type | property_type | median_error_pct | p80_error_pct | notes |
|---|---|---|---|---|
| Suburban tract | Single-family | 2–4% | 7–10% | Fresh comps; similar floor plans |
| Urban mixed | Townhome/Condo | 3–6% | 10–14% | HOA & amenity differences |
| Rural low-turnover | Single-family | 5–9% | 15–20% | Sparse, older comps |
| Unique/renovated | Custom SFR | 6–10% | 18–25% | Upgrades not in public data |
Download: avm-error-ranges-2026.csv
Columns: case_id, avm_value, contract_price, gap_pct, cause
| case_id | avm_value | contract_price | gap_pct | likely_cause |
|---|---|---|---|---|
| EX-001 | $310,000 | $330,000 | +6.5% | Recent renovation ignored |
| EX-002 | $425,000 | $395,000 | −7.1% | Roof/HVAC age; buyer credits |
| EX-003 | $199,000 | $180,000 | −9.5% | Tenant-occupied; repair backlog |
| EX-004 | $540,000 | $565,000 | +4.6% | Multiple offers; micro-market surge |
Download: valuation-gap-examples-2026.csv
Image credits: © 2025 Local Home Buyers USA. Licensed for use on this site. For third-party reuse, contact sales@localhomebuyersusa.com or see our content license.
No single number can capture every nuance of condition, timing, and terms. Treat it as a starting point. Validate with comps—or get a firm cash offer from us.
If you’ve got a unique home or major upgrades, an appraisal can anchor your pricing. In tract areas with active comps, a strong CMA might be enough.
As-is and speed carry a discount vs. pristine MLS sales. If convenience matters most, compare your AVM to our real cash offer and weigh net proceeds versus time and repairs.
Need a reality check beyond the algorithm? We buy houses nationwide. Start here: Get Offer or call 1-800-858-0588.