
The History of Real Estate & the 2025 Rise of Cash Offers
From clay tablets and feudal tenure to title insurance, mortgages, and e-closings—plus the public datasets showing why all-cash offers remain a major force today.
Real estate is one of humanity’s oldest information systems: a way to record rights in land, transfer those rights, and enforce claims. Across four millennia, societies experimented with ledgers (clay, papyrus, parchment, paper, and now digital), with legal rules to make transfers predictable, and with financial tools to unlock demand. Modern U.S. closings—deeds, notarization, title insurance, mortgage underwriting, and county recording—are the product of those experiments.
For sellers in 2025, one trend matters more than headlines: the durability of all-cash offers. Even after easing from 2023’s peak, cash purchases remain roughly one in three sales nationally, with certain metros dramatically higher. Below, we give a concise history, then turn to public datasets and documented market studies explaining why cash holds such a large share—and what that means for your timeline and net proceeds.
Quick links: Get an as-is cash offer · Compare listing vs. cash vs. hybrid · See datasets & licenses
1) Ancient Foundations: Ledgers, Notice & Enforceability
In Mesopotamia, durable cuneiform tablets documented contracts, taxes, and obligations—including land-related transfers and pledges. Egypt used papyrus; Rome used wax tablets and parchment. These records show two principles that still matter to sellers today:
- Public notice—transactions aren’t valid only by handshake; they gain force when recorded or witnessed.
- Priority—earlier claims hold ahead of later ones, a precursor to today’s recording and lien rules.
Roman law introduced dominium (ownership) and formal conveyance acts (e.g., mancipatio), influencing European and later American doctrines distinguishing possession from title—an idea at the heart of modern title insurance and escrow.
2) Medieval → Early Modern: From Feudal Tenure to Freehold & Notaries
Feudal systems tied land to layered obligations. Over centuries, conveyancing moved toward alienable freeholds, written deeds, and official witnesses (notaries). English equity courts and statutes (e.g., the 1536 Statute of Uses) clarified trusts and transfers. The goal was predictability: if rights are clear, markets can function. That predictability is why today’s sellers can rely on escrow, title search, and recording to get from offer to funding with fewer surprises.
3) 19th–20th Centuries: Title Insurance, Mortgages & the Standardized Closing
Local deed books and abstractors lowered risk but didn’t eliminate it. After a famous 1870s case in Pennsylvania, the first title insurer (incorporated in 1876) began indemnifying buyers and lenders against covered defects—converting research risk into an insurance product. In the 1930s–1950s, U.S. mortgage markets standardized fully amortizing loans and a robust secondary market. The consumer benefited: longer terms, lower default risk, and scalable suburban growth.
By the late 20th century, standardized settlement statements, truth-in-lending disclosures, and fair-housing rules improved transparency and access—frameworks that still guide modern closings.
4) 21st Century: Proptech, E-Signatures & County E-Recording
Online search, high-resolution tours, automated valuation models, remote online notarization, and county e-recording compressed the time from first click to recording. Technology didn’t change the deed; it accelerated the lifecycle—search → underwriting → signing → funding → recordation. For sellers, the payoff is speed and fewer unknowns.
5) Why Cash Offers Are Bigger Than Ever—What the Data Shows
Financing friction vs. cash certainty
When mortgage rates rise, financed buyers’ monthly payments jump; underwriting and appraisal risks increase; fall-throughs rise. Cash buyers sidestep those frictions. In competitive metros with tight inventory, sellers often pick verifiable cash even if the nominal price is slightly lower—because the net (after carrying costs and risk) can be higher.
Inventory & the “lock-in” effect
Millions of owners hold sub-6% mortgages from prior years. That “lock-in” effect constrains listings, magnifying competition for quality homes and boosting the share of serious, well-capitalized buyers—frequently cash. Public market trackers show cash shares elevated since 2023, with sizable metro-to-metro variance.
Where to inspect the numbers yourself
- Mortgage rates: Freddie Mac’s Primary Mortgage Market Survey (PMMS) via FRED.
- Prices & equity: FHFA House Price Index (HPI)—national, state, and metro series.
- Cash-share & metro indicators: Redfin Data Center (downloadable with reuse guidelines).
- Seller profits: ATTOM year-end reports.
Tip: Download CSVs, chart cash share vs. rates and inventory, and you’ll see why cash remains unusually durable post-2023.
Bloomberg-Style Cash-Offer Scenario Lab
Use this lab to stress-test how rates, list price, fall-through risk, and your own timeline affect the trade-off between “highest headline price” and certainty of close. It’s directional, not advice—but it mirrors how many sellers ultimately decide between listing and cash.
1. Describe your market & situation
How it feels when homes similar to yours hit the market.
Higher rates generally mean fewer qualified financed buyers and more leverage for verifiable cash.
If you listed with an agent tomorrow, what would you hope to ask?
0–10% = very stable • 20–30% = common retrades • 30–40% = high volatility.
1 = totally flexible • 5 = must exit ~30–45 days or faster.
This dashboard approximates how higher rates, fall-through risk, and your own timeline tilt the math toward certainty. It is not financial advice—just a way to visualize the trade-offs before you decide.
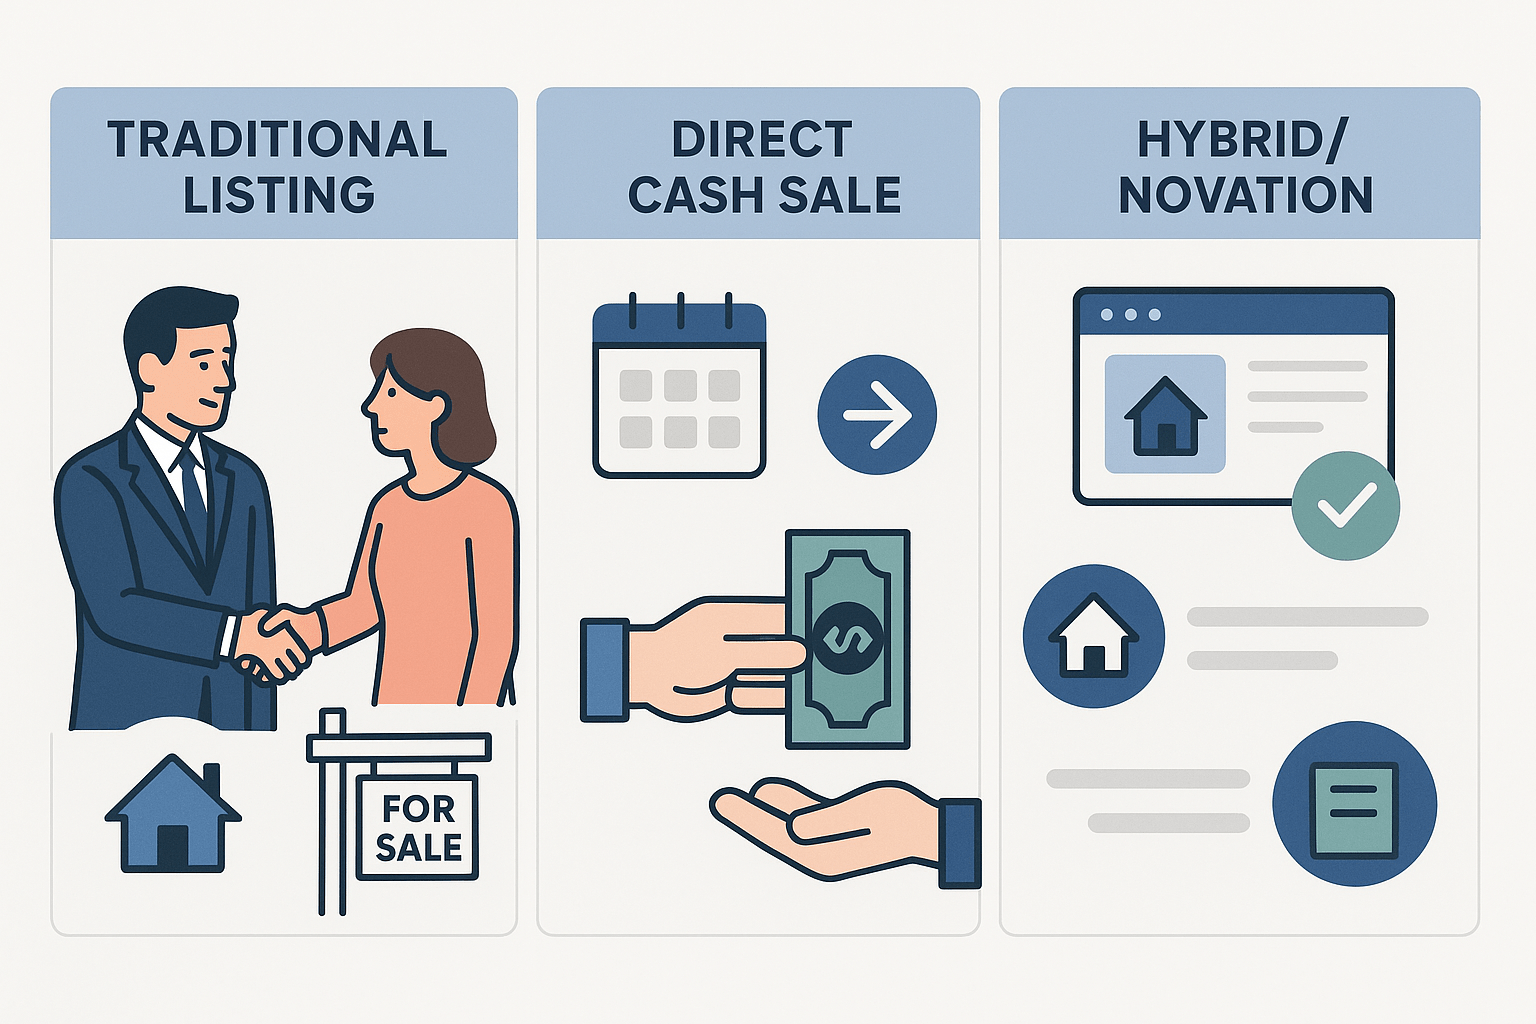
⚡Turn My Scenario Into a Real Cash OfferListing vs. Cash Offer vs. Hybrid/Novation — Side-by-Side
Use this matrix to weigh speed, certainty, and net proceeds for your exact situation.
| Factor | Traditional Listing (Agent/MLS) | Direct Cash Sale (Local Home Buyers USA) | Hybrid / Novation |
|---|---|---|---|
| Typical days to close* | 30–60+ (marketing, showings, lender conditions, appraisal) | ~7–14 (title permitting, no lender approval) | 30–60+ (marketing occurs after updated terms) |
| Repairs & prep | Often needed for top-of-market pricing | As-is; we handle repairs/cleanup | Usually limited; depends on agreement |
| Showings | Multiple; potential price reductions | No public showings | Minimal after novation terms |
| Appraisal / financing risk | Common; fall-throughs happen | None (no lender) | Low–moderate (depends on exit buyer) |
| Fees & commissions | Agent commissions + concessions possible | No agent commissions; standard closing/title fees apply | Disclosed novation/service fees; standard closing costs |
| Certainty of close | Good, contingent on buyer financing & inspection | High (verified funds; fewer contingencies) | Moderate–high with a vetted partner |
| Move-out flexibility | Negotiable, less flexible | Flexible close date; post-close occupancy possible | Negotiable, varies by agreement |
| Best for | Max exposure & top price if time allows | Speed, certainty, as-is convenience | Balancing net proceeds with reduced hassle |
*Actual timelines depend on title payoff, lien releases, HOA demands, probate, and county recording speeds.
Compare Your Net — Before You Decide
No repairs. No agent commissions. Close in as few as 7–14 days (title permitting). We’ll show you a transparent, side-by-side net sheet for listing vs. cash vs. hybrid.
⚡Get My Free, No-Obligation Cash Offer or call 1-800-858-0588
Want local specifics? Start here: Florida · Texas · Ohio · Indiana · North Carolina · Minnesota · Georgia
Seller Resources & Guides
Datasets, Sources & License Notes
Everything below is publicly accessible and broadly reusable with attribution; always confirm each site’s usage notes.
- Mortgage Rates: Freddie Mac Primary Mortgage Market Survey (PMMS) via Federal Reserve FRED — series MORTGAGE30US. FRED permits reuse with source attribution.
- Prices & Equity: Federal Housing Finance Agency — House Price Index (HPI). Public datasets (national/state/metro), downloadable.
- All-Cash Share, Inventory, Sales: Redfin Data Center (explicitly allows reuse with attribution; see “Guidelines for Using this Data”).
- Seller Profits: ATTOM — Year-End U.S. Home Sales & Profit Reports.
- Ancient & Legal History (for context): Library of Congress cuneiform collections; standard Roman-law references (property/ownership concepts); early title-insurance histories (Philadelphia, 1870s).
Attribution example for charts/tables drawn from public sources: “Source: Freddie Mac PMMS via Federal Reserve FRED; FHFA HPI; Redfin Data Center; ATTOM.”