
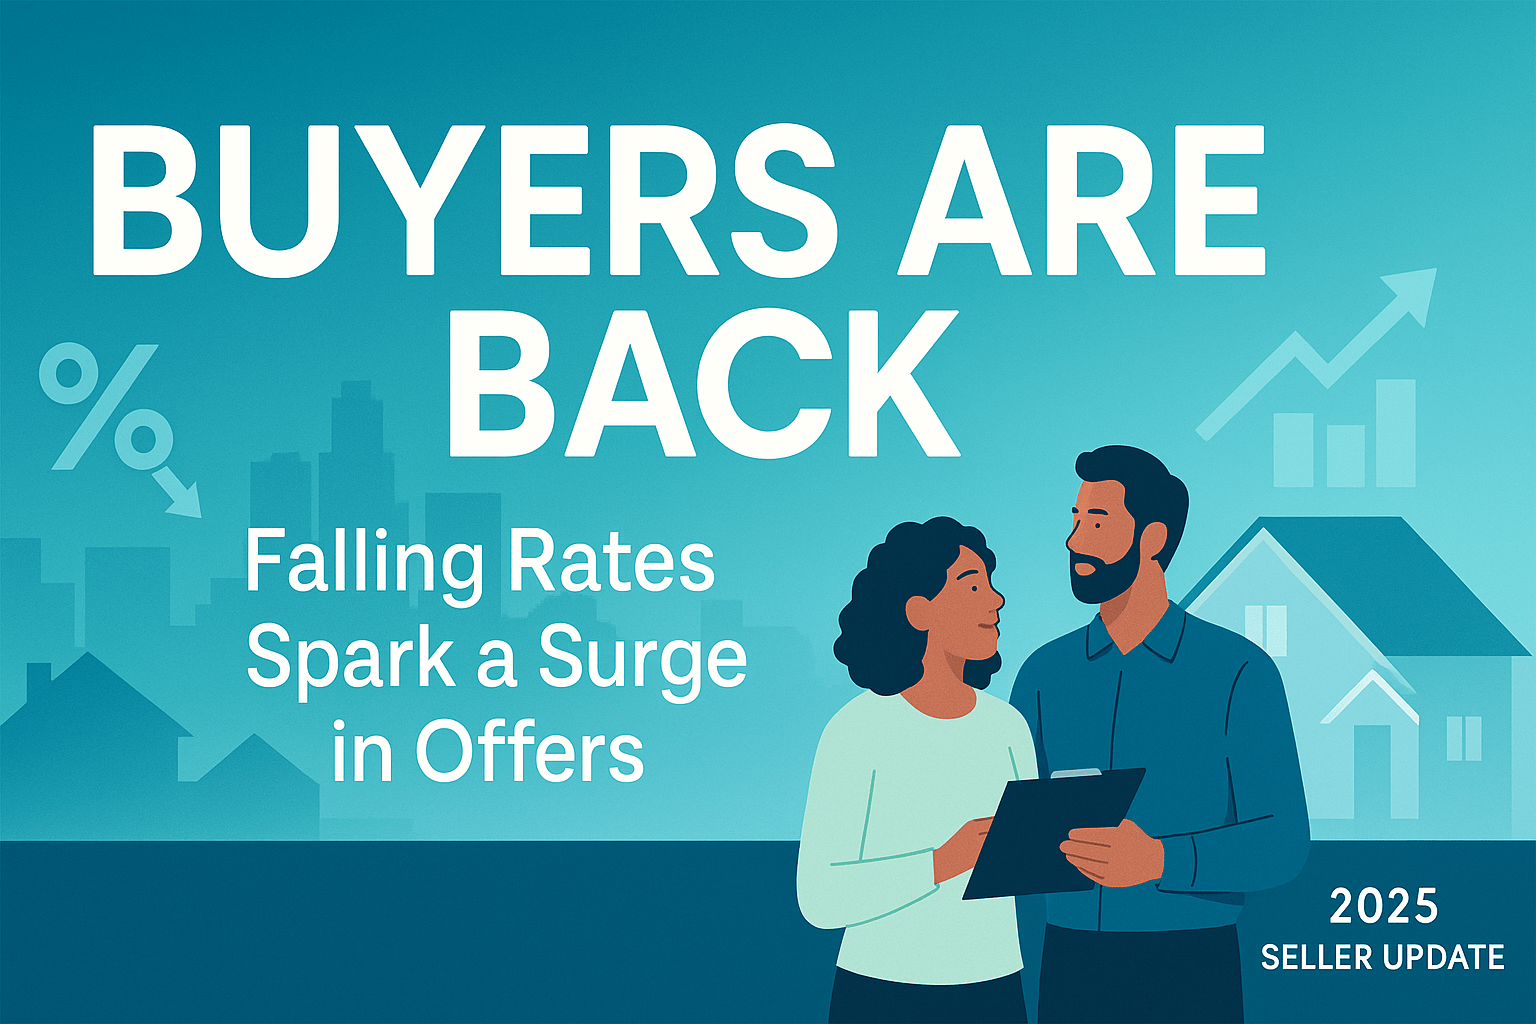
2025 Seller Update
Buyers Are Back: Falling Rates Spark a Surge in Offers
A practical, no-hype guide for homeowners to use the new demand wave—while protecting timeline, net, and certainty.
- Rates eased, improving affordability and unlocking buyers who were sidelined at higher monthly payments.
- We’re seeing more inquiries, faster second showings, and shorter offer timelines on clean, fairly priced homes.
- But results are still local and execution-dependent—use pricing-to-payment, clean disclosures, and strong title work.
- Use the on-page tools below: monthly payment calculator, state payment bands, and a live states index with only active pages.
Who we are
Local Home Buyers USA is a nationwide direct buyer and guide for sellers choosing between a fast, certain cash sale and a financed retail sale. We publish how-to resources, state guides, and our Research Data Catalog & License so readers can review our data sources and methods.
How we write (methodology)
We emphasize local comps over national averages, provide transparent checklists, and link to authoritative resources. Internal links below connect to step-by-step playbooks like the Cash Offer Cookbook, Home Pricing 2026, and 50-State Probate & Redemption Guide.
Why lower rates can flip buyer behavior fast
- Payment math: Small APR changes can move hundreds of dollars in P&I, reopening popular monthly bands for financed buyers.
- Move-up chains: Lower rates can increase refinance activity and unlock listings, improving matches and days-on-market.
- Investor recalibration: Cheaper debt refreshes cap-rate math; more bids show up for rent-ready and value-add homes.
However, macro isn’t destiny. Every zip code reacts differently. That’s why we recommend this paired toolkit:
- Monthly Payment Helper to price to the payment
- Popular Payment Bands by State to align with local thresholds
- States Index to jump into your market’s guide
Foundation reads: Ignore Headlines—Go Local, Bubble Guide 2025–2026, Remote Closing for Out-of-State Owners, and the Cash Offer Cookbook.
Monthly Payment Helper
Estimate principal & interest (P&I). Taxes/insurance/HOA vary by property.
Tip: If this stays under a common local threshold (e.g., $2,000 or $2,500), demand usually widens. Pair this with our local pricing guide.
Popular Payment Bands by State
Pick a state to see common buyer monthly-payment targets (P&I). Adjust to match your market intel.
Use this with the Monthly Payment Helper. Then compare paths with the Cash Offer Cookbook and our local pricing guide.
Explore Our State Guides
Only states with live pages will appear below.
Seller playbook: Use this window like a pro
1) Price to the payment
Anchor to monthly thresholds popular in your market. Then align your list/offer pricing to sit inside a threshold—not above it. Start with the tools above and our guide: Home Pricing 2026.
2) Prioritize certainty
Score offers on speed, certainty, and net—not just top-line price. See the Cash Offer Cookbook for a simple comparison scorecard.
3) Prepare like a pro
- Collect payoff/HOA/lien info early.
- Knock out low-cost, high-impact fixes (lighting, smell, curb appeal).
- Stage virtually if vacant; schedule shoots for best light.
4) Protect your closing
Use verified wiring instructions and ID checks to avoid fraud. If an estate or redemption period is involved, start with the 50-State Probate & Redemption Guide.
Managing from another state? Our full remote closing playbook covers e-notary, attorney mail-away, and mobile-notary options by state.
Which path nets you more—with less headache?
| Option | Best For | Timeline | Typical Seller Costs | Key Risks |
|---|---|---|---|---|
| Accept a strong cash offer | As-is, quick move, high certainty | 7–21 days | $0 agent fees; we cover typical seller costs | Lower top-line vs retail; higher certainty |
| List with an agent | Time to test the open market | 30–90+ days | ~6–10% fees + prep | Repairs, showings, finance/appraisal fallout |
| FSBO | Hands-on sellers minimizing fees | 30–120+ days | Low–med | Marketing and legal complexity; time cost |
Use the Cash Offer Cookbook to score Speed, Certainty, and Net. If probate is involved, cross-check state timelines in the 50-State Probate & Redemption Guide.
Ready to see your best options—without pressure?
Get a fast cash offer to compare against a financed sale. We’ll show your net either way and close on your timeline (as fast as 7–14 days).
Get My No-Obligation Cash OfferNo repairs • No showings • Typical seller costs covered
Realistic timelines (cash vs. financed)
Cash sale (as-is)
- Day 0–1: Info call & walkthrough (virtual or in-person)
- Day 2–3: Formal cash offer & signed purchase agreement
- Day 3–10: Title verification; payoff/HOA statements
- Day 10–21: Closing on your chosen date
Financed sale (listed)
- Week 1–2: Prep, photos, listing live
- Week 3–6: Showings; offers; inspection
- Week 6–10+: Appraisal, underwriting, potential retrades
- Week 10–13+: Closing, subject to lender timing
Compare with our Cash Offer Cookbook and keep pricing aligned with local comps. If you’re selling an inherited property, start with the 50-State Probate & Redemption Guide.
Deep dives for sellers: Bubble Guide 2025–2026, Home Pricing 2026, Remote Closing, Cash Offer Cookbook, and our Research Data Catalog & License.
Watch: How a fast, safe sale actually works
Data sources & transparency
- Rate and demand commentary is based on widely tracked indicators (mortgage rate surveys, bond yields, mortgage-application indices, pending-sales reports). We emphasize what you can control: pricing, packaging, and clean closings.
- We publish our public-facing data catalog and license for transparency: Local Home Buyers USA Research Data Catalog & License.
- Always validate local assumptions with your title agent, attorney, or real-estate professional.