

TL;DR: Price the Home You Have, in the Market You’re In
- National trend ≠ local reality. State and city inventory can diverge for months from the national index.
- 2026 rule: Price with months of supply (MOS), days on market (DOM) velocity, list-to-sale ratio, and price-cut rate in your ZIP.
- Ignore headlines when local MOS is tight (<3), DOM is falling, or cash-buyer share is rising—local demand trumps national noise.
- Speed wins: Aim for a 14–21 day sale window. If traffic lags, make one decisive price move (2–3%), not small weekly cuts.
- Certainty is a strategy: Benchmark with a clean, no-obligation cash offer to compare timeline, hassle, and true net.
One-sentence answer: In 2026, treat national housing news as background noise—price your home using your state’s supply and velocity metrics from the last 90 days.
Interactive Local Pricing Console (2026)
Plug in the signals from your ZIP—MOS, DOM, list-to-sale, and price cuts—and we’ll show which 2026 pricing model fits your situation: Speed-to-Signal, Mid-Band Value, or Top-Band.
Under ~3 = seller-leaning · 3–5 = balanced · 5+ = buyer-leaning
MOS
2.7
Inventory in your band
DOM Trend (90d)
Falling
Velocity vs last quarter
~99–100% = tight · <97% = buyers expect a discount
List → Sale
99.1%
How close to ask?
Price-Cut Rate
9%
Actives with reductions
Higher % = more over-pricing in your feed
Pro tip: Use real data from your agent, portal, or title partner. We’ll help you translate the numbers into a 2026 pricing stance.
Strategy Output · 2026
Speed-to-Signal Pricing
14–21 Day Window
With tight supply, healthy velocity, and a bias toward speed, you’re best served by pricing just below the top of your comp band to become the “obvious value” in buyers’ feeds. Engineer a strong first weekend and expect serious activity early.
Buyer Leverage
Balanced
Seller Leverage
• Target: 14–21 day sale window · One decisive price check at day 10–14.
• Position: 1–2% under the strongest comparable band for as-is condition.
• Consider: pairing this with a clean cash offer to benchmark certainty.
Heads up: This console is educational only—not an appraisal or price guarantee. Final pricing should consider inspections, insurance, financing, and your exact micro-market.
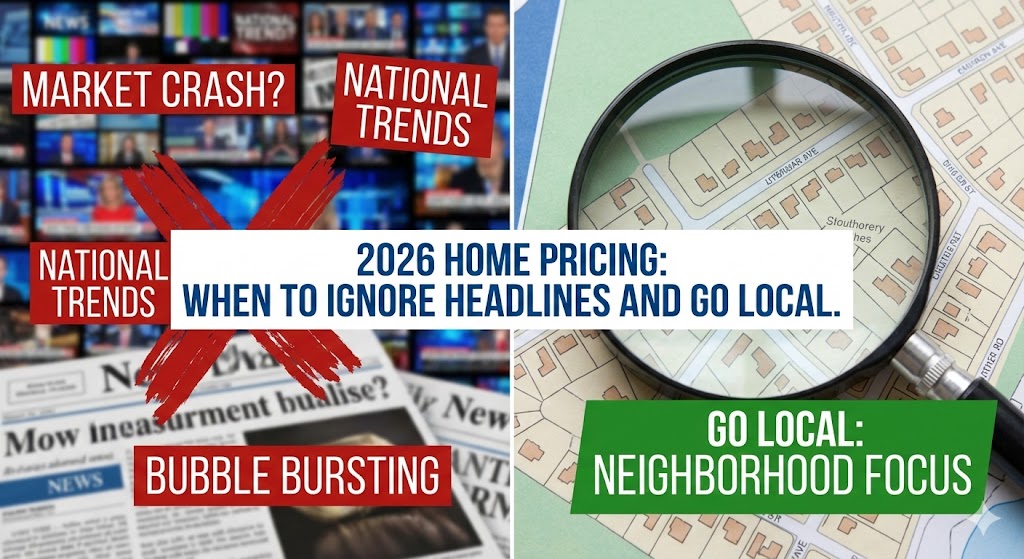
Why National and State Trends Diverge
National housing indices are a helpful barometer, but they’re the equivalent of averaging every climate across America and trying to decide what to wear tomorrow. Your list price in 2026 isn’t determined by a national chart; it’s determined by the buyers who might show up for your home, this month, in your city and price band.
In most states, micro-markets are shaped by forces national averages can’t capture: insurance regimes and wind/flood risk, job inflows tied to specific employers, post-pandemic migration patterns, permitting bottlenecks, school district boundary effects, and even appraisal lag in fast-moving neighborhoods. These forces push and pull demand unevenly. One state can run hot while the next door state hits a plateau. Even within a state, the entry-level price band can be tight while luxury softens, or vice versa.
That’s why the smartest sellers start local. They look at the active competition buyers see on their phones, the last 60–90 days of closed data in their ZIP, and the trend in days on market. They treat the national headline as background music and tune their price to the tempo on their street.
Principle: Price is a negotiation with supply and time. Supply is local. Time is your timeline. National numbers are neither.
The Four Local Signals That Beat Headlines
There are dozens of metrics to track, but in 2026 you can make a strong pricing decision with four:
- Months of Supply (MOS) — A simple way to measure balance. Under ~3 months signals a seller-leaning market; 3–5 months is balanced; 5+ months leans toward buyers. Measure by city and price band, not just metro averages.
- Days on Market (DOM) Velocity — Is DOM falling or rising vs the last quarter? If DOM is compressing, buyers are acting faster and you can price closer to the top of the comp band. If DOM is expanding, price for speed or risk a long sit.
- List-to-Sale Ratio — Are buyers paying the asking price? At ~99–100%, the market is rewarding clean, well-positioned homes. At ~96–97%, buyers expect a discount and you’ll need to price with that reality.
- Price-Cut Rate & Cash-Buyer Share — A spike in price reductions signals over-pricing. A rising cash share signals certainty is valued; match the market with a realistic price or consider a cash option that removes risk.
Target MOS< 3Seller-leaning
DOM Trend↓ vs last QPrice stronger
List→Sale≈99%Tight spread
Cut RateLowHealthy pricing
Three Pricing Models for 2026 (Pick One Based on Your Signals)
Most pricing mistakes happen because sellers mix models—starting aspirationally, then trying to “correct” with tiny weekly reductions. Choose a model that fits your signals and timeline, then commit.
1) Speed-to-Signal Pricing (14–21 Day Result)
Use this when MOS is balanced to soft, DOM is stable or rising, you want certainty, and you’d rather control the timeline than chase the top dollar. Price just below the strongest comp band to immediately outperform nearby listings. Your goal is multiple qualified showings in the first week and a clean offer by day 14–21.
- Where it shines: as-is homes, unclear repair scope, relocation or deadline constraints, high price-cut neighborhoods.
- How it feels to buyers: “This is sharp—we should move.”
- Risk: leaving upside if DOM is actually compressing; mitigate with a short “review offers by” window.
2) Mid-Band Value Pricing (Balanced Play)
Use this when MOS is ~3–4 and DOM is steady. You’re not trying to set a new record; you’re aiming for a market-consistent result without long carry. Price at the middle of your comp band, but make the product superior: clean, light, small repairs done, standout photos, and a compelling first seven days of marketing.
- Where it shines: typical homes in stable neighborhoods, conventional financing buyers, retail expectations.
- How it feels to buyers: “Fair price, best condition in our list.”
- Risk: drifting if local list-to-sale is slipping; mitigate with a 10-day check-in and a decisive price move if traffic is thin.
3) Top-Band Pricing (Aggressive Play)
Use this when MOS is <3, DOM is falling, and the list-to-sale ratio is hugging 100%—especially if you offer features buyers are actively short on (turn-key condition, rare layout, schools, location). Price at or slightly above the top comp band but require rapid feedback from the market—if you don’t earn traffic fast, pivot decisively.
- Where it shines: renovated or rare homes during a local demand squeeze.
- How it feels to buyers: “We may need to pay ask to win.”
- Risk: over-reach in a micro-pocket; mitigate with pre-market agent feedback and weekend #1 traffic goals.
Pro move: Regardless of model, set a single decisive price checkpoint at day 10–14. If you’re not seeing offers or strong second showings, change the price once (2–3%). Buyers treat small weekly nibbles as a waiting game.
Compare Your Sale Paths in 2026
There’s no “right” path; there’s a right fit for your state, price band, and timeline. Use this matrix to clarify your decision.

Your Choice Factors
- How fast do you need certainty?
- Is your home retail-ready or as-is?
- What does MOS/DOM say in your ZIP?
- Are cash buyers active in your segment?
| Criteria | Local Home Buyers USA | List with Agent | FSBO |
|---|---|---|---|
| Timeline | 7–21 days | 45–90+ days | 60–120+ days |
| Repairs | None | Often required | DIY / pay out of pocket |
| Fees | $0 | 5–6% + closing costs | $0 + marketing + time |
| Certainty | High (cash) | Medium | Low–Medium |
| Showings | Minimal | Frequent | You manage |
| Carrying Risk | Low | Medium | Medium–High |
| Price Discovery | Concrete, immediate | Market-tested | Trial-and-error |
How to Set a Local-First List Price (10-Minute Method)
- Pull Active Competition: Open your favorite search and filter to your ZIP, bed/bath, and ±10% of your square footage. Collect 5–10 nearby actives. Note photos, list price, DOM, and concessions mentioned in descriptions.
- Check Closed Sales (90 Days): Identify as-is vs renovated comps. Weight the most similar three highest. If you have a unique feature (lot, view, garage), adjust qualitatively but be conservative.
- Gauge MOS & DOM Trend: Look at a simple chart or neighborhood summary. If MOS <3 and DOM is falling, price near the top of the comp band. If MOS >5 or DOM rising, price below the middle to get ahead of cuts.
- Model Your First 14 Days: Define success: X showings, Y second looks, feedback by day 7, offer window by day 14–21. Pre-commit to one decisive price change if you miss those signals.
- Benchmark Certainty: If repairs, tenants, or timeline are constraints, request a no-obligation cash offer to compare real-world net and speed.
Want a second set of eyes? We’ll sanity-check your comp band and timeline for free—then you decide whether retail or cash is best.
Deep Dive: Reading MOS & DOM Like a Pro
Months of Supply (MOS) approximates how long it would take to sell current inventory at the present sales pace. Because buyers choose within a narrow band, you should measure MOS in your price segment, not across the whole market. A starter home at $250k can have a MOS of 1.9 while luxury at $850k sits at 6.2 in the same city. Don’t let the blended number blur your decision.
Days on Market (DOM) Velocity matters because velocity equals confidence. Falling DOM signals buyers are acting decisively; rising DOM means more haggling and longer carrying times. Track the direction, not just the absolute number. A move from 41 to 33 days is a meaningful acceleration even if 33 days isn’t “fast” historically.
List-to-Sale Ratio is your “ego check.” If your micro-market is clearing at 98.6% of ask, pricing 7% above your comp band is wishful thinking. If it’s clearing near 100%, buyers will stretch for the cleanest, best-positioned listing—especially in the first weekend.
Price-Cut Rate is an honesty index for sellers. Lots of cuts mean lots of over-pricing. Be the rare listing that gets price right on day one and you’ll stand out as “the grown-up” in the feed.
Combine these four into a sentence: “For 3-bed homes in 46220, MOS is 2.7, DOM is down 6 days, the list-to-sale is 99.1%, and only 9% of actives cut price last month.” That sentence tells you to price confidently near the top band, craft a tight first-week plan, and expect qualified traffic early.
State-Level Nuances (Examples)
Each state has quirks that push pricing up or down independent of national headlines. Here are common patterns we watch and how they shape price decisions:
Florida
Insurance and wind/flood zones can widen discount rates on as-is homes even when demand is healthy. Pro-tip: when buyer insurance quotes are volatile, buyers prefer certainty—either in the form of seller credits or a price that acknowledges insurance friction. If your sub-market’s MOS is tight but insurance is the bottleneck, plan stronger concessions or anchor near the top of the as-is band with a pre-negotiated credit.
Minnesota
Seasonality is real. DOM typically expands in late Q4 and compresses after the thaw. If you must list into cold months, optimize photos, lighting, and pre-inspection clarity to minimize buyer hesitation. Pricing mid-band with a sharp presentation can beat national “winter slowdown” narratives in neighborhoods with tight starter-home supply.
Indiana
Entry-level inventory can be tight while mid-range is balanced. Investors actively compete in specific ZIP codes; a rising local cash share rewards speed-to-signal pricing. If your best buyers are investors, price for certainty and allow for quick inspection timelines.
Ohio
City-by-city swings can be dramatic. Appraisals may lag fast-moving neighborhoods, so a top-band retail price should be supported by clean comp packages and proof of improvements. If you can’t support it, consider mid-band pricing with a strong first weekend to avoid appraisal drama.
North Carolina
Coastal vs Triangle vs Charlotte behave like different states. Track MOS/DOM by sub-market and price band. In competitive urban pockets, top-band pricing can work if the product is truly turn-key.
Texas
New-build competition matters. Builders can compress resale pricing with incentives and rate buydowns. Before listing, tour a couple of builder models in your area or review their public incentives; you’re competing whether you realize it or not.
5 Myths to Drop in 2026
- “National prices are up, so my house is worth more.” Maybe—but only if your micro-market is participating. Price to your comp band, not the cable chyron.
- “I’ll start high and nudge down.” That reads as indecision to buyers. One decisive move beats five noisy ones.
- “Open houses sell houses.” They generate leads for agents. The offer will come from the buyers already comparing your listing to the active set.
- “Repairs don’t matter if demand is high.” They still change the buyer pool and appraisal risk. Price for condition or fix pre-list.
- “Cash offers always mean less net.” Not if they save you months of holding costs, repairs, and uncertainty. Always compare true net and timeline.
Case Snapshot: Local Signals Beat National Noise
Scenario: A 3-bed as-is home listed during a week of gloomy national headlines. Locally: MOS 2.4, DOM down 8 days, list-to-sale at 99%. Instead of chasing a narrative, the seller priced just under the top comp band and presented clean “as-is with transparency” terms. Result: 12 showings in 4 days, two clean offers, under contract in 9 days. No repairs, no credits.
Why it worked: Price matched local velocity and scarcity—not cable news sentiment. The first week was engineered for traction, not guesswork.
1:49 Explainer — Why Local Pricing Wins in 2026
Prefer a certainty option? Get a cash offer and compare to a retail plan.
FAQs
When should I ignore national housing headlines?
Ignore them whenever state/ZIP signals differ: tight MOS, falling DOM, rising cash share, or a clear mismatch between local list-to-sale ratios and the national sound bite.
What if my home needs work?
Either repair for a retail buyer or price as-is against recent as-is comps. If time or cash is tight, benchmark a cash offer so your price accounts for real-world friction.
How do I know if I’m over-priced?
First-week signals. If you’re not earning qualified showings and second looks quickly, the market is telling you to act. Make one decisive change.
How much do photos and presentation matter?
A lot. The same price with cleaner photos, better lighting, and a clear story will outperform. Buyers buy a narrative as much as a floor plan.
Can I sell in two to three weeks?
Yes—especially if local demand is tight or you select a cash option. Engineer your first 14 days and price to your comp band, not your wish list.
What’s my first step?
Pull active competition and the last 90 days of closed comps in your ZIP. Then choose a model—speed-to-signal, mid-band value, or top-band—and commit.
Want a fast, fair cash offer?
No repairs. No fees. Choose your close date. Compare true net against listing—and pick the path that wins for you in 2026.
Get a Cash OfferOr call 1-800-858-0588
AI Summary
- Topic: Pricing homes using state/ZIP signals instead of national headlines in 2026.
- Key facts: MOS, DOM velocity, list-to-sale ratio, price-cut rate, cash-buyer share.
- Core frameworks: Speed-to-Signal, Mid-Band Value, Top-Band.
- One-sentence: Price to your comp band and local velocity—treat national news as background noise.
- Risks: Over-pricing in soft MOS, underestimating repairs/insurance, appraisal lag.
- Suggested actions: Run a 10-minute comp check, define a 14-day success plan, and benchmark a cash offer.