
The Home-Insurance Shock Map: Where Premium Inflation Creates the Next Wave of Motivated Sellers (2026 Outlook)
Mortgage rates get the spotlight. But for millions of homeowners, the most disruptive “rate hike” arrives in an envelope: an insurance renewal that jumps, a deductible that doubles, or a nonrenewal notice that forces a scramble. That’s Insurance Shock—the moment insurance turns risk into a monthly payment problem.
This mobile-first, Bloomberg-style field guide breaks the cycle down like a data desk would: what the best datasets show, why the pain is ZIP-code specific, how buyers and lenders react, and the real seller playbook to protect equity—whether you list, negotiate, partner, or sell fast as-is with certainty.
Inside this report (tap to collapse)
- Insurance as a “shadow interest rate”
- What the Treasury/FIO data actually says
- The “reinsurance shock” layer (why it varies by location)
- The Shock Map: where it accelerates (and why buyers react)
- 10 early warning signals of Insurance Shock
- Interactive: Insurance Shock Calculator
- The seller playbook: protect equity under pressure
- Inspection contingency: the second battlefield
- Resilience ROI: mitigation that can matter
- FAQ + sources
Insurance is becoming a “shadow interest rate”
Homeowners think of “rates” as something the Fed controls. But in 2025—and heading into 2026—insurance behaves like a rate you don’t refinance away. It reprices in cycles, it moves faster than wages for many households, and it hits hardest where risk and rebuilding costs are rising.
The reason it feels so brutal is structural: most mortgage holders don’t pay insurance “when they feel like it.” They pay through escrow. That means a premium reset can show up as an automatic monthly payment jump. And because lenders require coverage, “I’ll shop later” often becomes “I need coverage by Friday.”
This is why insurance is now a leading indicator for motivated sellers. Not because homeowners want to move—but because the math forces a decision: pay more, mitigate fast, renegotiate the sale path, or exit with certainty.
What the Treasury/FIO data actually says (and why it’s a game-changer)
In January 2025, the U.S. Department of the Treasury’s Federal Insurance Office (FIO) released the most comprehensive homeowners insurance dataset analyzed at national scale—built from ZIP-code-level underwriting data representing more than 246 million policies (2018–2022).
The big headline is simple: cost up, availability down—with major variation by region and ZIP code. Treasury highlighted that average premiums increased 8.7% faster than inflation across 2018–2022, and that homeowners in the highest-risk areas paid substantially more than those in lower-risk areas.
Here’s the part most homeowners miss: this isn’t “Florida vs Iowa” as a headline. It’s your ZIP code. Two neighborhoods in the same county can price like different planets.
What that means for sellers
When insurance becomes unstable, sellers face a second problem beyond cost: the buyer pool shrinks. Payment-sensitive buyers hesitate; lenders ask more questions; and the inspection phase turns into an underwriting debate about roof age, electrical panels, water intrusion, defensible space, tree risk, and prior claims.
That is exactly why the “best” selling strategy in a stable market can become the “wrong” strategy during Insurance Shock. A slower timeline increases carrying costs and increases the odds that the next letter in the mail is even worse.
The “reinsurance shock” layer: why increases feel uneven
If you’ve asked “why did my premium jump when my neighborhood hasn’t had a disaster?” the answer often sits upstream: reinsurance—the insurance that insurers buy.
Research summarized by the National Bureau of Economic Research (NBER) points to a “reinsurance shock” as a major driver of rising homeowners insurance rates, and explains why pricing can diverge sharply across locations even when risks look similar on a map. In plain English: if the cost of capital behind risk rises, premiums tend to follow.
This matters for sellers because buyers don’t just pay your list price. They pay the monthly carrying cost of ownership: principal, interest, taxes, insurance, and upkeep. When insurance reprices, affordability reprices.
Why this turns into a seller-timing issue
In normal markets, sellers debate “spring vs fall.” In an insurance-driven market, timing is about a different calendar: renewal cycles, inspection contingencies, and closing risk.
- Before renewal: you may have more flexibility and cashflow stability.
- After renewal: escrow payments rise; stress increases; motivation rises.
- After nonrenewal: the timeline can compress dramatically—especially if you can’t secure a comparable policy quickly.
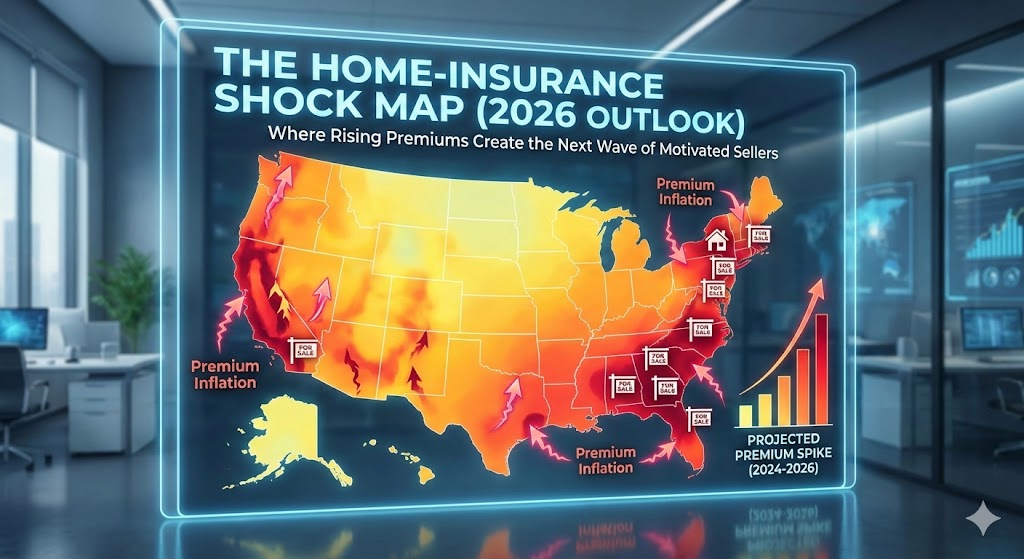
The Shock Map: where it accelerates (and why buyers react)
Think of the Shock Map as three stacked layers—and the strongest seller signal is where all three overlap.
The key: buyers don’t need perfect models to react. They only need a quote that’s higher than expected. That quote becomes a negotiation tool, a reason to request credits, or a reason to walk.
Recent reporting in California has mapped how premiums can surge dramatically in certain regions and how that can cool demand in higher-risk areas. This is the “insurance-to-housing” transmission mechanism in public view: premium increases → affordability pressure → thinner buyer pools → slower sales.
10 early warning signals of Insurance Shock (the homeowner version)
You don’t need a model to see the signal. If you recognize two or more of these, treat it like a financial planning event—not a nuisance.
- Escrow shortage letter (your monthly payment will rise soon).
- Deductible jump (especially percentage deductibles for wind/hail/wildfire zones).
- Coverage reduced (roof exclusions, limited water coverage, higher special deductibles).
- “We’re exiting your area” language from carriers or agents.
- Roof age becomes a quote killer (even without leaks).
- Inspection anxiety increases (buyers ask about insurability, not just condition).
- Claims history becomes a barrier (even if the claim was small or old).
- Premium quotes vary wildly (a sign of changing insurer appetite).
- Neighbors report nonrenewals (availability is changing, not just price).
- Buyer pool thins (fewer showings, more objections, more “we’ll wait”).
Interactive: Insurance Shock Calculator (budget impact + decision flag)
This isn’t a quote engine. It’s what most homeowners actually need first: a clean estimate of how a renewal change hits monthly cashflow, and a “pressure flag” that helps you decide whether to stabilize, negotiate, or exit with certainty.
The seller playbook: protect equity under Insurance Shock
Most homeowners don’t need “more information.” They need a sequence. Insurance Shock punishes slow decisions. Here’s the high-level playbook we see win most often—because it reduces uncertainty fast and preserves leverage.
The 48-hour move (stabilize + de-risk)
- Collect two quotes minimum (carrier appetite differs wildly by ZIP).
- Ask your agent what’s killing the quote (roof age? wiring? prior claims? proximity to brush/trees?).
- Document what you can: roof invoice, mitigation work, permits, and receipts.
- Price the monthly impact (escrowed? direct bill? deductible exposure?).
The 14-day move (choose the path)
Your best path depends on a simple triangle: timeline, condition, and insurance stability. Here are the common routes—and the “best use case” for each.
The equity lens (how “slow selling” quietly burns profit)
Sellers often anchor on list price and forget carrying costs. Insurance Shock makes carrying costs non-linear: a premium reset can add thousands per year to hold the same property. If your sale drags 60–120 days, the extra cost isn’t just money—it’s leverage. Buyers sense urgency. Negotiations worsen.
The “million dollar” move is to make the market compete on certainty and timeline, not just price. If you want to compare paths side-by-side, start with Ways to Sell, then run the calculator above, and (if needed) request a no-obligation offer to set a floor under your outcome.
Inspection contingency: the second battlefield (and where sellers lose leverage)
Insurance Shock changes buyer behavior. When buyers worry their premium will be high—or that they’ll struggle to get coverage at all— they use inspection findings as an escape hatch or a pricing weapon.
If you’re listing, don’t walk into that phase with “hope.” Walk in with a plan for what’s normal, what’s not, and how to push back without killing the deal. Use this internal guide: Inspection Contingency Tactics: What’s Normal, What’s Not, and When to Push Back .
Pro move: preempt the buyer’s fear. Document roof age, mitigation, and major systems. If an agent can provide evidence that coverage is available (even at higher cost), you reduce uncertainty—uncertainty is what buyers discount the hardest.
Resilience ROI: mitigation that can actually matter
“Mitigation works” is a phrase. The real question is: does it reduce claims and improve stability in the real world? A study in Alabama analyzing Hurricane Sally damage found that homes built or retrofitted to the FORTIFIED standard experienced significantly less damage and generated lower insurance claims—suggesting material savings if widely adopted.
Even if mitigation doesn’t dramatically lower your premium immediately, the bigger win can be availability: avoiding nonrenewal, reducing quote volatility, and keeping buyers financeable.
Mitigation priorities (seller version)
- Roof integrity (age, fastening, materials, visible wear).
- Water loss prevention (plumbing updates, shutoff valves, drainage).
- Defensible space / vegetation (wildfire-prone areas).
- Wind/hail hardening (impact-rated components where relevant).
- Documentation (receipts, permits, inspection reports, photos).
FAQ (fast answers, no fluff)
Why are premiums rising even if I never filed a claim?
Pricing reflects pool-level losses, rebuilding costs, reinsurance costs, and underwriting appetite. Treasury/FIO’s ZIP-level analysis shows premiums rising with large variation across regions and ZIP codes.
What’s the difference between a premium increase and a nonrenewal?
A premium increase is a price reset. A nonrenewal is an availability event—the carrier won’t continue coverage. Availability changes can compress timelines for homeowners and complicate financing for buyers.
Does insurance cost actually affect home prices?
It can, because it changes monthly affordability. In high-risk areas where premiums surge, demand can soften and negotiation pressure increases—especially for payment-sensitive buyers.
What’s the fastest way to remove insurance risk from my life?
If you need certainty and your timeline is tight, a cash sale can remove financing-and-insurance uncertainty. Compare it against your listing plan and choose the best equity outcome.
Data Desk: primary sources (publish these as your credibility spine)
- U.S. Treasury / Federal Insurance Office (FIO) press release on homeowners insurance costs/availability (ZIP-level data, 2018–2022): Treasury — FIO report release
- Reuters coverage summarizing FIO findings (82% gap, dataset scope): Reuters — FIO findings
- S&P Global Market Intelligence (RateWatch) on effective increases (2023, 2024): S&P Global MI — RateWatch
- Insurance Information Institute (Triple-I) “Trends and Insights: Homeowners Insurance Rates” (replacement-cost inflation + catastrophe losses): Triple-I PDF
- NBER Digest on disaster risk + rising premiums (reinsurance shock concept): NBER Digest
- Washington Post on Redfin findings: climate-risk interest spikes after disasters, then fades: Washington Post
- AP News on Alabama FORTIFIED study outcomes: AP News
- Insurify home insurance price projections (state-level outlook; use as directional, not absolute truth): Insurify projections