
1) Where we stand now: the late-2025 baseline
Before looking ahead to 2026, we anchor the outlook in what’s observable today. The baseline below uses authoritative, regularly updated datasets so you can sanity-check every claim—and rerun the story as fresh numbers drop.
Sales, prices & months of supply. The National Association of REALTORS® (NAR) reported that August existing-home sales ran at 4.0 million SAAR, with a median price of $422,600 and 4.6 months of inventory. Looser than the 2021–2022 frenzy, tighter than a true buyer’s market. In plain language: the market is negotiable but not distressed.
Time-to-sell. Realtor.com’s latest Monthly Housing Market Trends (September) shows the typical home spent 62 days on the market, while price cuts increased and list prices were broadly flat—classic signs of a market cooling back toward normal, with big local exceptions.
Rate backdrop. On financing costs, Freddie Mac’s PMMS placed the 30-year fixed near the low-6% range in early October (6.34% for the Oct. 2 survey week). Slight wiggles week to week, but the bigger story is that rates have been parked above 6% long enough to put a real affordability ceiling on many buyers.
Listing flow & active supply. Throughout 2025, Realtor.com tracked year-over-year gains in active listings, even as late-summer momentum cooled. Redfin’s weekly data adds nuance: active listings fell 1.4% month-over-month in August, the sharpest seasonally adjusted drop since 2023. In other words: supply is improving, but not in a straight line.
Forward compass. For 2026, mainstream forecasts are cautious but constructive. Fannie Mae’s ESR Group projects home price growth of ~1.1% (Q4/Q4) in 2026 and mortgage rates near 6.0% by year-end, while Zillow’s research portal maintains a slightly positive 12-month home-value outlook after a subdued 2025.
Bottom line: Heading into 2026, the market looks cooler and more balanced than the pandemic highs. That shifts the game from “throw it on the market and pick an offer” to precision: price, presentation, and Plan B (cash or as-is) if time or uncertainty is your real enemy.
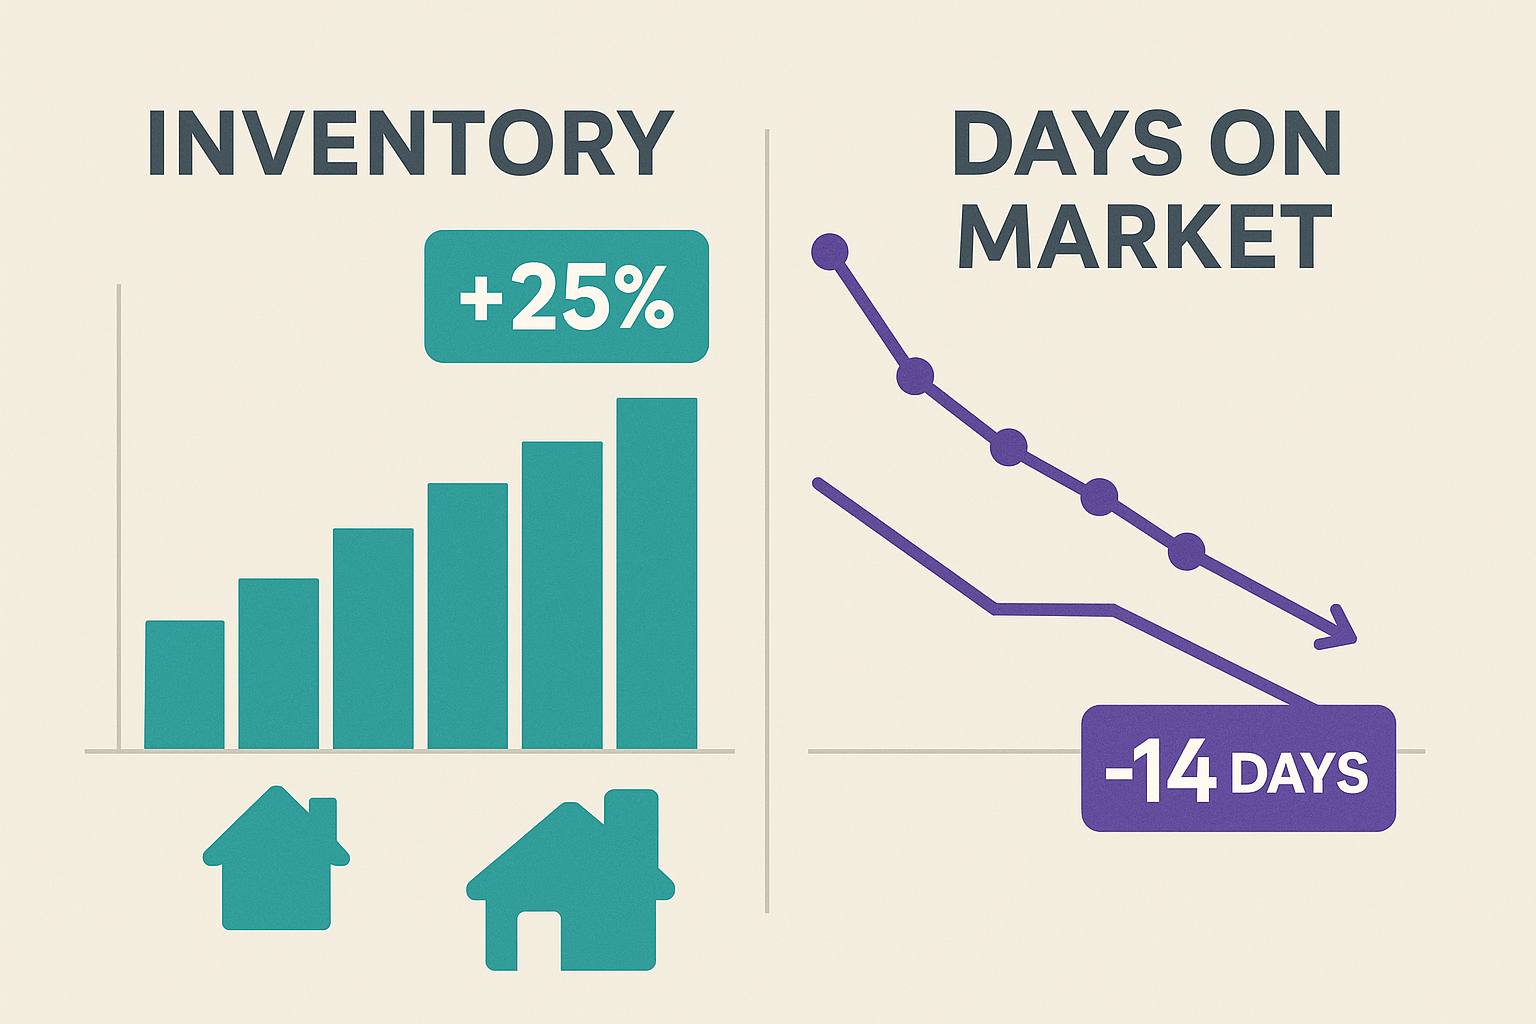
2) Inventory in 2026: will the market finally feel “normal”?
Inventory is the fulcrum of pricing power. As months of supply climbs from crisis-tight levels toward the 4–6 month “balanced” band, buyers gain leverage, but well-priced homes still move. NAR’s August reading of 4.6 months frames the 2026 conversation: tighter than a true buyer’s market, looser than 2021–2022.
2.1 What actually moves inventory
- Active vs. new listings. Realtor.com’s monthly series continues to show year-over-year gains in active listings, even as late-2025 growth decelerated. Redfin’s August read, however, flagged a month-over-month drop in active supply. Translation: 2026 supply is likely to arrive in pulses, responding to rates, sentiment, and local headlines.
- New construction pipeline. FRED data for Housing Starts, Building Permits, and Completions shows builders leaning on incentives to move standing inventory. Softer multifamily permitting could put a mild cap on 2026 supply growth in some markets.
- Homeowner vacancy rate. The homeowner vacancy rate sits near ~1.1%—historically low. That keeps the “for-sale” pool from ballooning unless a macro shock forces widespread selling.
- Lock-in vs. life events. Millions of owners still enjoy sub-4% mortgages, which discourages casual moves. But relocations, inheritance, divorce, insurance pressure, and HOA assessments—especially in parts of the Sun Belt—continue to drip new listings into the market.
2.2 Base-case supply shape for 2026
Putting that together, the realistic base case is a market that keeps rebalancing but doesn’t flood. National months of supply in 2026 probably averages around 4.7–5.0 months, with a seasonal late-summer bump and big metro-to-metro dispersion (West/South generally looser, Northeast tighter).
2.3 How to read your local supply in real time
Because months of supply is a snapshot driven by both demand and supply, you should pair inventory gauges (active and new listings) with contract activity (pendings) for the freshest read.
Two free, very practical resources:
- The Redfin Data Center (weekly CSVs)
- The Realtor.com data library
Inventory vs. Months of Supply
Stylized NAR baseline · 2019–2026 outlook (illustrative)
3) Prices: flat to modest gains nationally, with bigger splits by region and tier
Price is where headlines live—but it’s rarely where the smartest decisions are made. For 2026, both survey-based forecasts and listing data point to a market that is neither crashing nor soaring, but sorting itself out after a wild few years.
Model-based baselines. Fannie Mae’s ESR Group projects ~+1.1% home price growth in 2026 (Q4/Q4) alongside total home sales near 5.35M. Zillow’s home value forecast likewise suggests slightly positive appreciation into mid-2026 after a soft 2025.
Listing-side signals. Realtor.com’s September report shows flat list prices on average, a rising share of price cuts (about one in five listings), and stark regional splits—softer in parts of the West and South, firmer in many Northeast markets. See the details in the monthly release.
What that means for you. Price to today’s comps, not last year’s headlines. In oversupplied pockets (especially condo-heavy or insurance-stressed areas), expect buyers to ask for concessions and be picky about condition. In tighter submarkets, sharp presentation and correct pricing can still pull strong offers quickly.
4) Days-on-Market (DOM): sticky at a 2017–2019 pace
Days-on-Market is where most sellers feel the new regime. Realtor.com reports a median DOM of 62 days in September, while NAR’s time-on-market metric came in at 31 days for August. Different methodologies, same direction: 2026 will feel a lot more like 2017–2019 than 2021.
Why DOM stays sticky in 2026.
- Affordability friction persists even if rates ease a bit.
- Inventory is no longer famine-level, so buyer attention is spread out.
- Many sellers still start too high, then ride the “price-cut escalator” while DOM balloons.
Realtor.com’s weekly trends show time-on-market running six to seven days slower than a year earlier—another data point in the same direction.
Practical implication. Build a price-review checkpoint into your plan at day 10–14. If views, saves, and tours are lagging the competition, adjust quickly rather than waiting for the market to “wake up.”
5) Mortgage rates & the Fed: what the path implies for sellers
Rates are the valve that opens or constrains demand. Freddie Mac’s PMMS places the 30-year fixed in the low-6% range as October begins, while the Federal Reserve’s September Summary of Economic Projections (“dot plot”) points to a lower fed-funds rate by end-2026 than end-2025. Fannie Mae’s baseline expects ~6.0% mortgages by late-2026.
Small moves matter: a 50–100 bps drop in rates can be the difference between “we’re browsing” and “we’re writing an offer.” But because so many owners hold sub-4% loans, modest easing won’t unleash every would-be seller at once.
Stylized mortgage-rate path into 2026
Based on Freddie Mac PMMS + Fed SEP baseline (illustrative, not advice)
6) What this means for your seller strategy in 2026
A balanced-to-cool market rewards sellers who think like portfolio managers: define your priority (top-line price, speed, or certainty), then design the transaction backward from that outcome.
Timing & readiness
- Seasonality vs. carrying costs. Spring and early summer still concentrate demand, but if repairs, taxes, or insurance are eating your cash flow, selling sooner can maximize what you walk away with after time and risk.
- Paperwork first, marketing second. Get payoff quotes, HOA docs, claims history, and preliminary title in order early.
- Stage for the camera. Light, decluttered photos reduce buyer uncertainty far more efficiently than expensive cosmetic overhauls.
Pricing & concessions
- Price to the comp band. Starting unrealistically high often lowers your net after weeks of carrying costs and visible markdowns.
- Lead with terms. Offer a 2-1 buydown or closing credit and hold the line on price.
- Make day-14 your line in the sand. If traffic is soft, change the story—via price, concessions, or a pivot to a cash/as-is exit.
Speed options
- Cash buyers compress time. NAR’s August snapshot shows ~28% of sales were cash.
- “As-is” doesn’t mean “give it away.” Focus repairs on safety, water, and roof issues, and price honestly to condition.
7) Scenario planning for 2026 (with seller playbooks)
Housing turns slowly. Scenario planning lets you decide how aggressive to be on price and terms without reacting to every headline.
| Scenario | Rates | Prices | Inventory | DOM | Seller play |
|---|---|---|---|---|---|
| Base case | Drift toward ~6.0% by late-2026 (Fannie Mae ESR) | Flat to +2% nationally; wider metro dispersion (Zillow) | ~4.7–5.0 months average (NAR baseline: 4.6 months in Aug) | Near 2017–2019 pace (Realtor.com 62-day median) | Price at-market, pre-announce concessions, and trade a little price for a lot more certainty when needed. |
| Faster-easing | Rates slip below 6% earlier if inflation cools and Fed cuts continue (SEP) | +3–4% nationally; Northeast/Midwest firmer | New listings improve, but absorption quickens; months of supply steady ~4.6–4.8 | Shorter DOM | Test a slightly higher list price, use offer deadlines, and watch for appraisal-gap risk. |
| Re-tightening | Rates stall or back up | 0% to −3% nationally; softer pockets in oversupplied metros | Sellers pull back; inventory progress stalls; buyers hesitate | DOM stretches; price-cut share rises | Lead on terms (credits, buydowns), and keep a realistic as-is cash option on the table. |
Sell vs Wait Calculator (Interactive)
Compare three paths side by side: traditional listing, fast cash sale, and wait-and-hold. This is a simplified model—not advice—but it makes the tradeoffs visible.
Assumptions: retail closing costs ≈1% of sale price; cash closing costs ≈0.5%; “wait and sell” assumes similar commission/closing costs later and slightly higher repair risk. Numbers are illustrative only—use them to frame the decision, not as legal, tax, or financial advice.
8) Regional & property-type nuances sellers should expect
Northeast
Inventory remains comparatively tight and price-per-square-foot often outpaces the national average.
Midwest
Steady demand, realistic pricing, and fewer insurance shocks make the Midwest one of the more balanced stories.
South
Rapid-growth metros plus insurance and HOA assessments make this the most mixed region. Your street, not just your city, matters.
West
Divergence is stark: some enclaves are tight; condo-heavy corridors are seeing more price discovery and longer DOM.
Condo markets deserve special attention: in several metros, listings are stacking up relative to buyers because of fees, assessments, and insurance.
Video: how a fast, no-drama sale works
Sometimes the best move is to stop guessing and see your numbers. This short video walks through how a fast, as-is cash offer works with Local Home Buyers USA.
If the embed is blocked by a browser extension, open directly: https://www.youtube.com/watch?v=tqL6mPMtXmU
Ready to sell smarter in 2026?
If you want speed, certainty, and a clean close, we’ll show you your numbers in plain English—no repairs, no fees, no surprises.
Prefer a traditional listing? We’ll still help you compare options side by side.
Frequently asked questions
Are we heading for a price correction in 2026?
Most baseline forecasts do not point to a large national decline. Fannie Mae’s ESR Group projects around +1.1% home-price growth (Q4/Q4) in 2026, while Zillow’s 12-month outlook turned slightly positive after a soft 2025.
Will inventory finally return to pre-pandemic “normal”?
Not fully. Months-of-supply has improved but remains below six months nationwide. The homeowner vacancy rate around 1.1% limits how large the for-sale pool can become without a macro shock.
How long will it take to sell my home?
Plan around 2017–2019-style timelines. Realtor.com shows a 62-day median DOM; NAR’s time-on-market read was 31 days (different methodologies, same direction).
Do cash buyers still matter?
Yes—cash shortens timelines, reduces fall-through risk, and can be decisive in inspection-sensitive or insurance-sensitive markets.
Editorial standards (E-E-A-T)
Experience: This outlook consolidates primary datasets from NAR, Realtor.com, Redfin, Freddie Mac, the Federal Reserve (FRED), Zillow Research, and Fannie Mae. Trust: We link directly to sources and show ranges where forecasts differ. Informational only—not legal, tax, or financial advice.